Where is the best place in Canada to spend your real estate dollars right now? That was the question the Moneysense website set out to answer, analyzing such factors as average home price, return on investment (ROI) and economic factors such as the unemployment rate in order to determine the best cities in Canada to buy real estate in 2018.
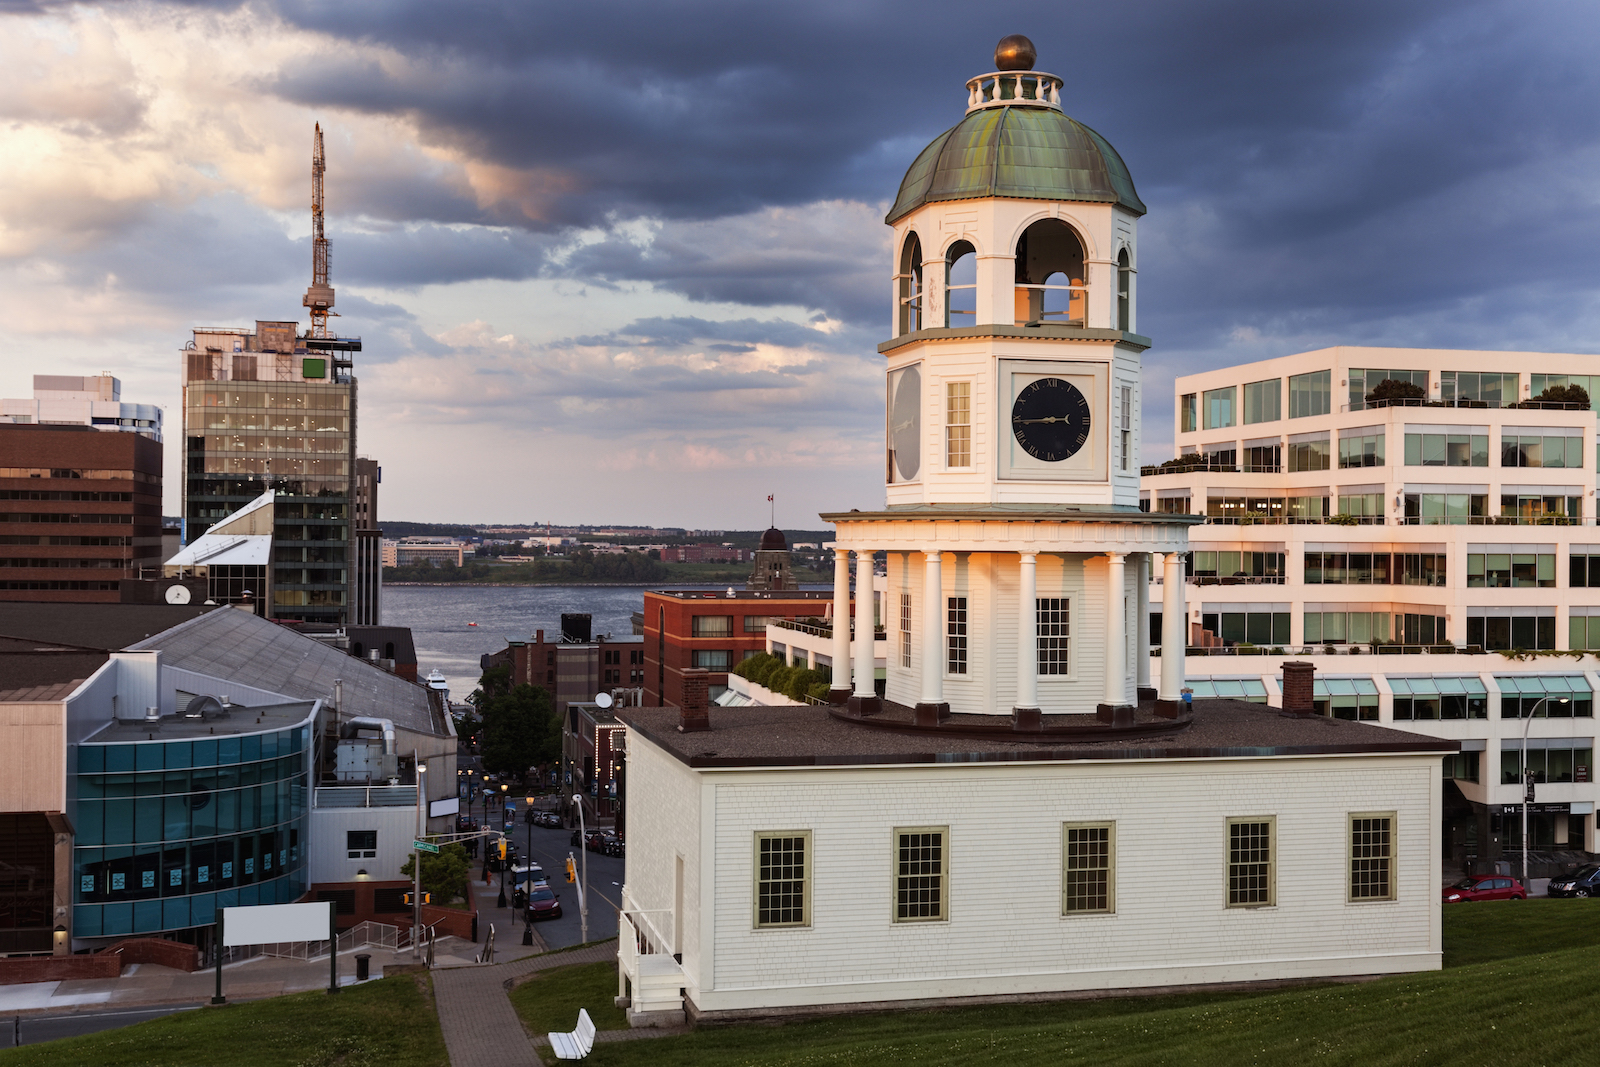
25. Halifax, NS
Average home price (2017):
$498,244
Average income to home price: 5.7
5-year annual ROI: 3.1%
Average 5-year rent increase: 15%
Previous year’s unemployment rate (2017): 5.4%
Looking for a getaway and money’s no object? Check out Canada’s Most Expensive Airbnb Rentals
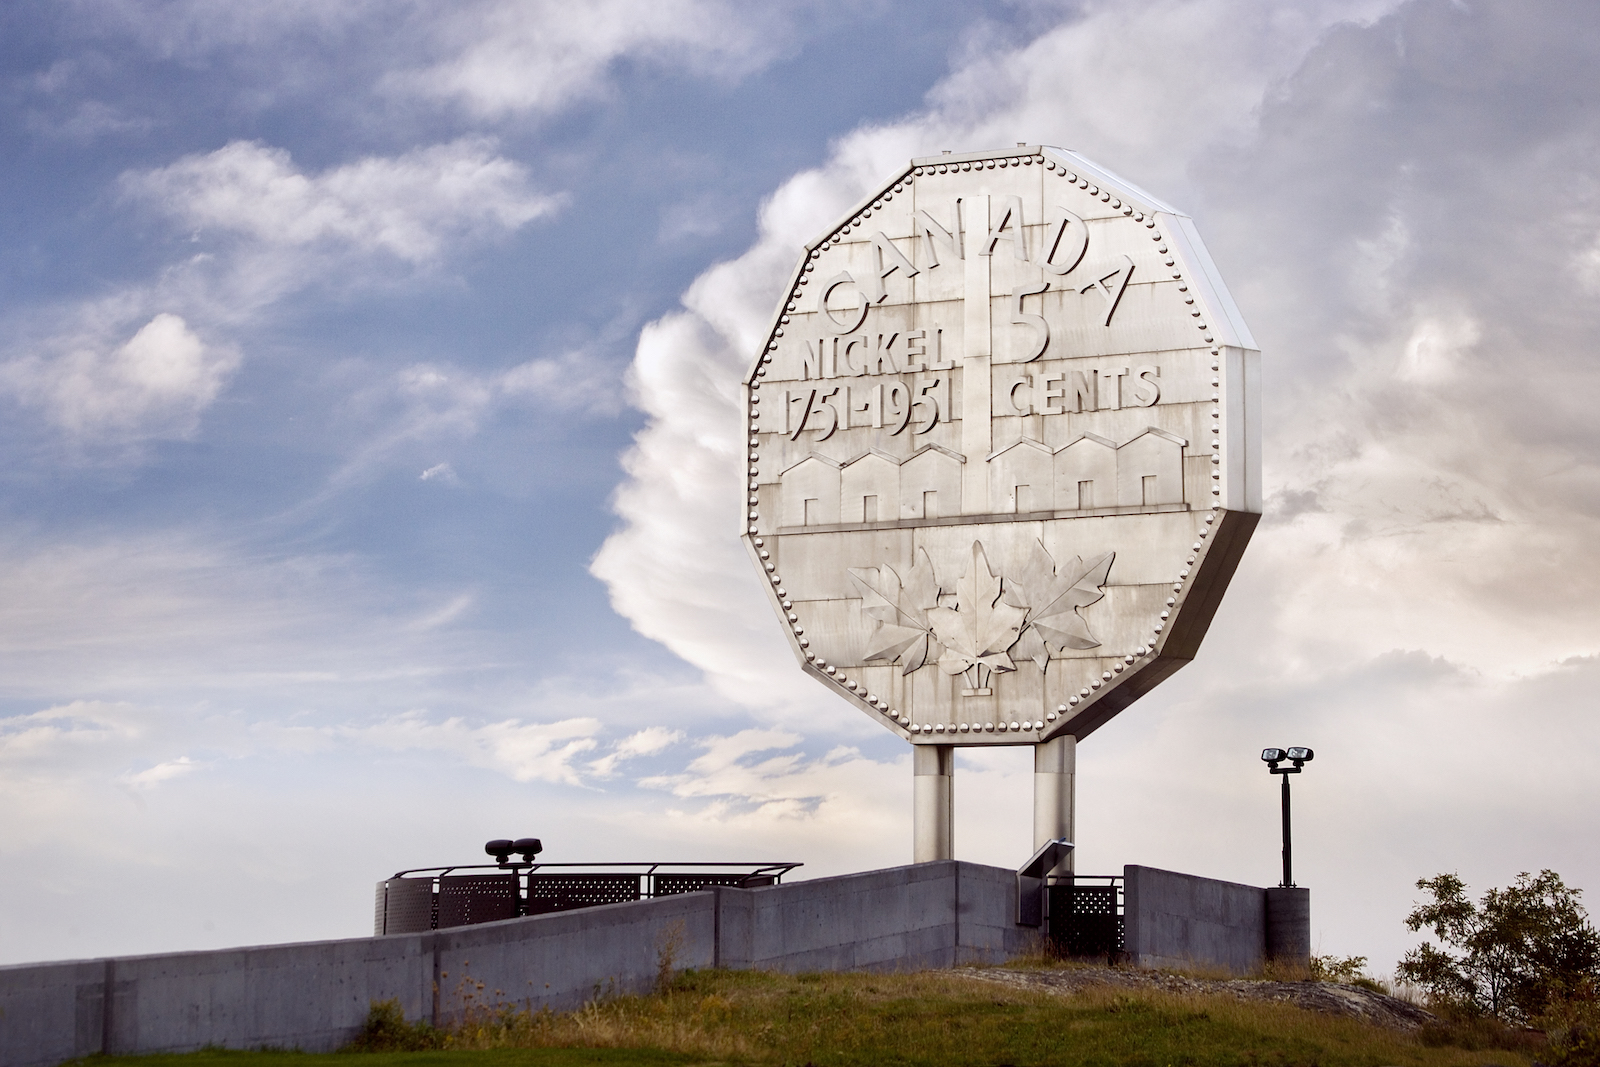
24. Greater Sudbury, ON
Average home price (2017):
$524,800
Average income to home price: 5.4
5-year annual ROI: 6.5%
Average 5-year rent increase: 15%
Previous year’s unemployment rate (2017): 6.8%
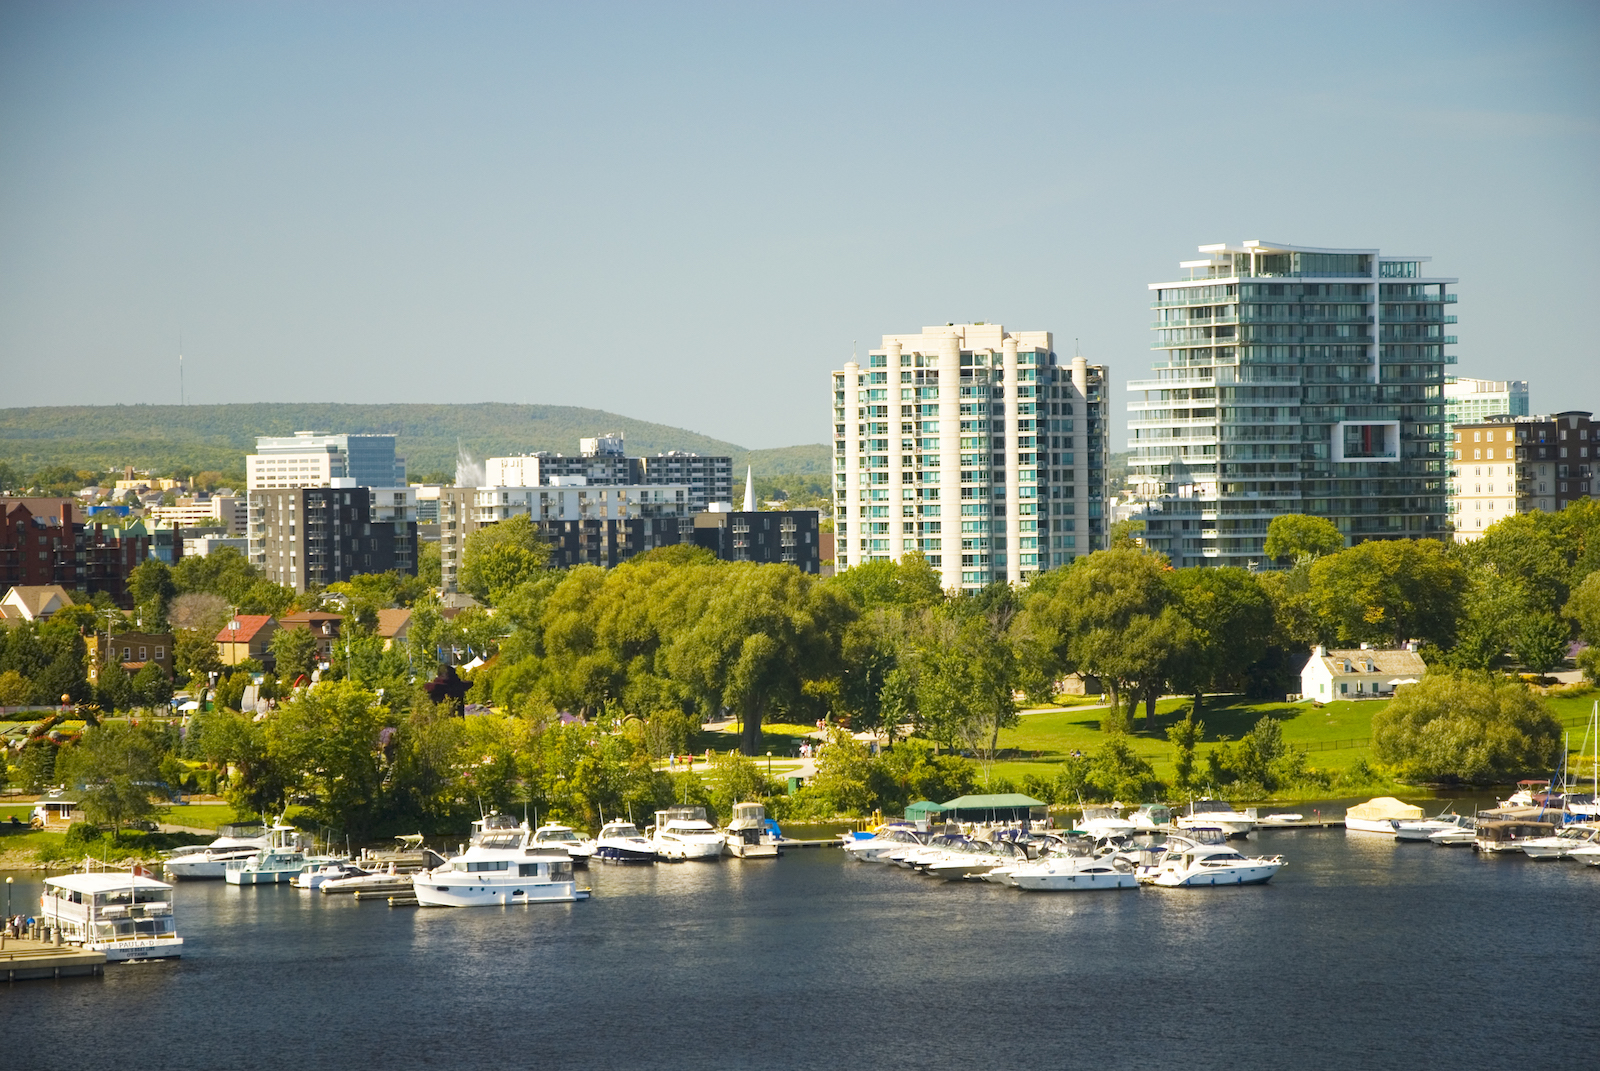
23. Gatineau, QUE
Average home price (2017):
$421,939
Average income to home price: 3.9
5-year annual ROI: 2.8%
Average 5-year rent increase: 5%
Previous year’s unemployment rate (2017): 5.4%
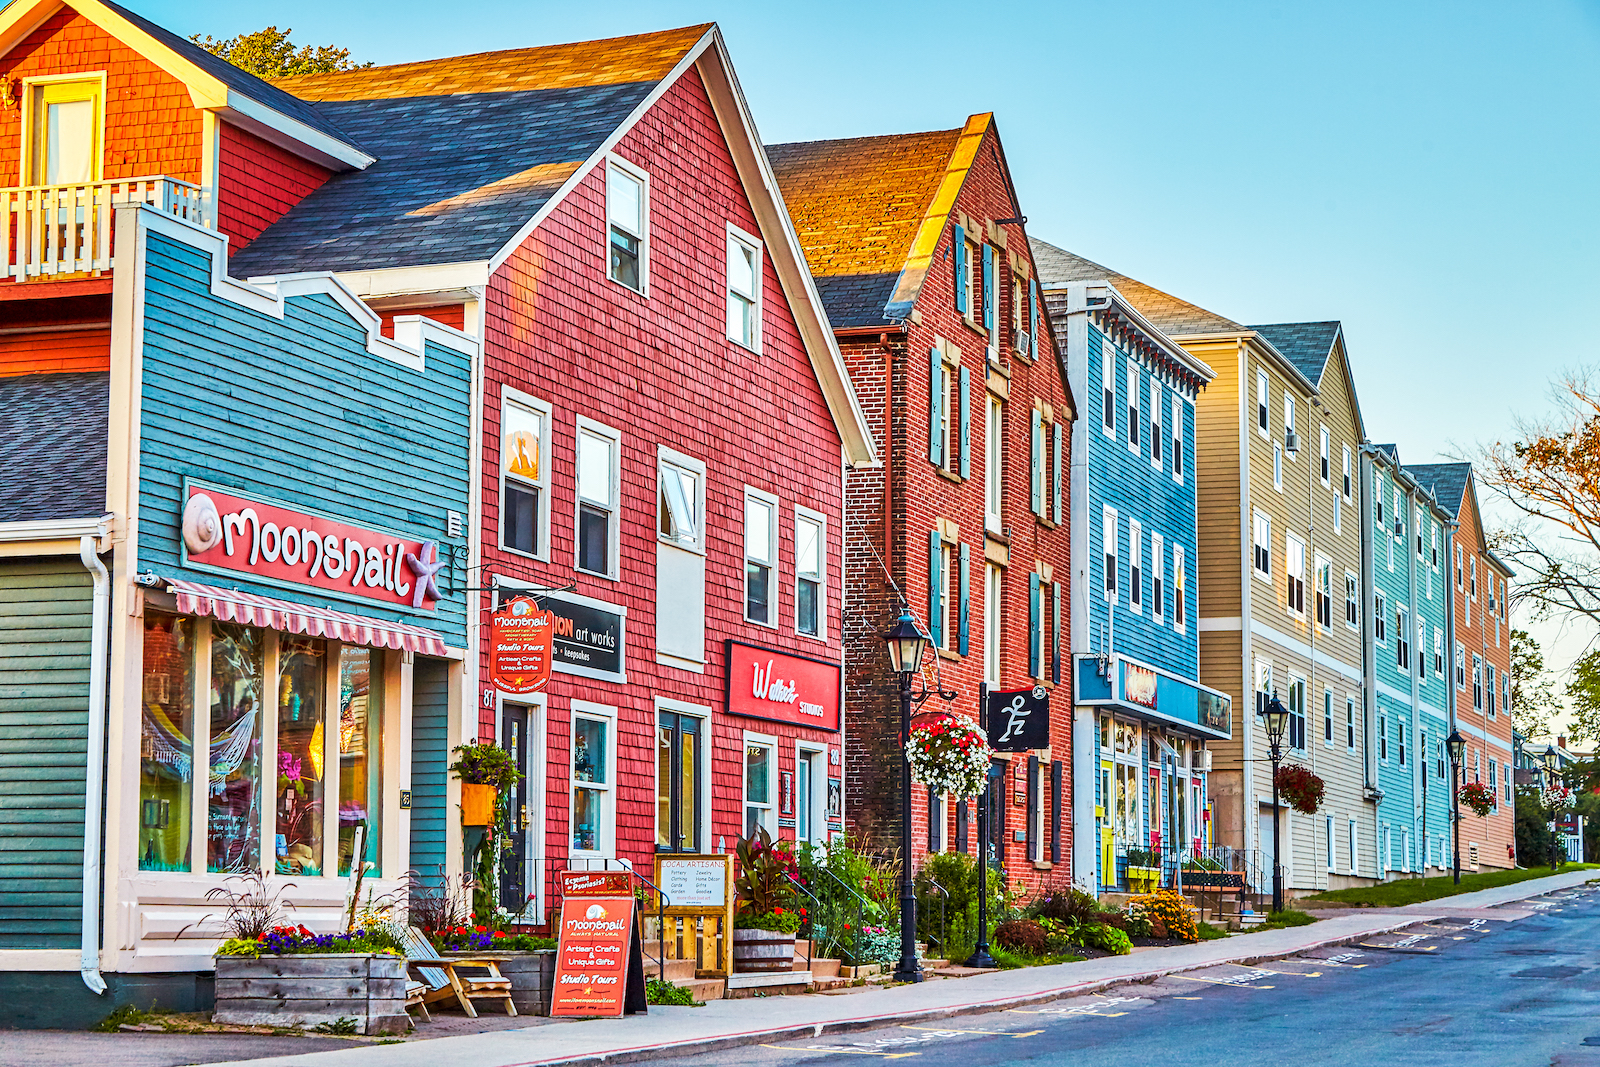
22. Charlottetown, PEI
Average home price (2017):
$312,182
Average income to home price: 3.9
5-year annual ROI: 2.7%
Average 5-year rent increase: 13%
Previous year’s unemployment rate (2017): 9.8%
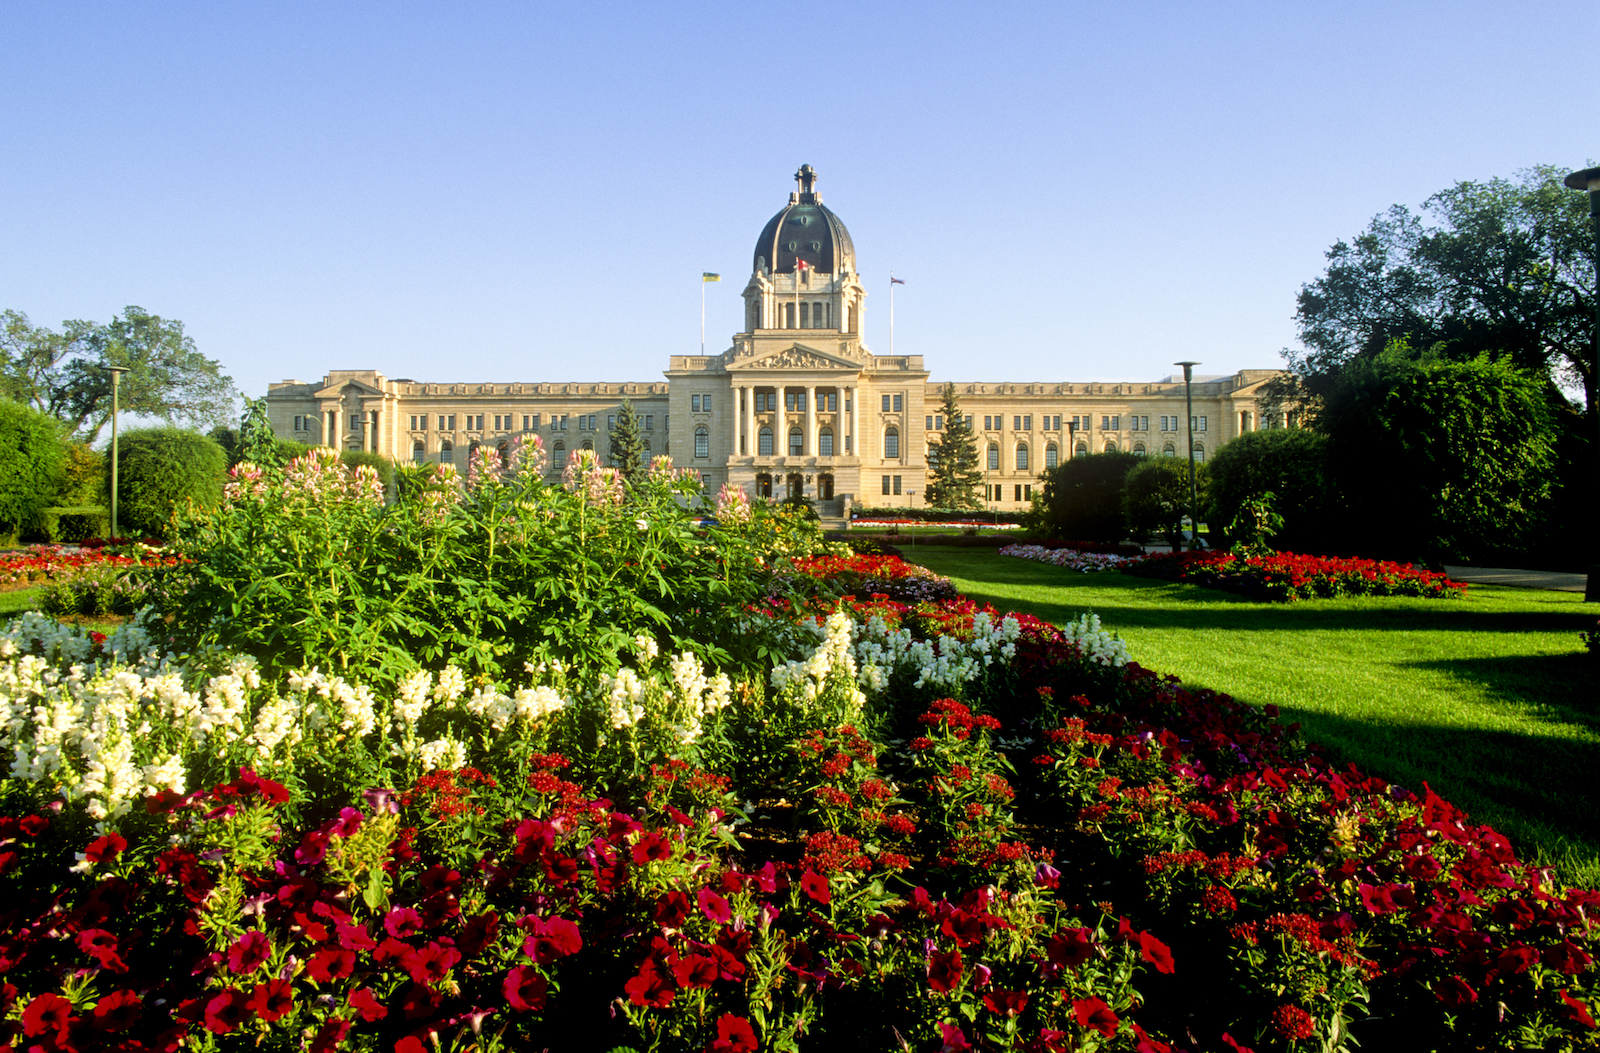
21. Regina, SK
Average home price (2017):
$520,963
Average income to home price: 4.9
5-year annual ROI: 2.4%
Average 5-year rent increase: 14%
Previous year’s unemployment rate (2017): 4.2%

20. Moncton, NB
Average home price (2017):
$342,729
Average income to home price: 4.2
5-year annual ROI: 3.3%
Average 5-year rent increase: 8%
Previous year’s unemployment rate (2017): 5.5%
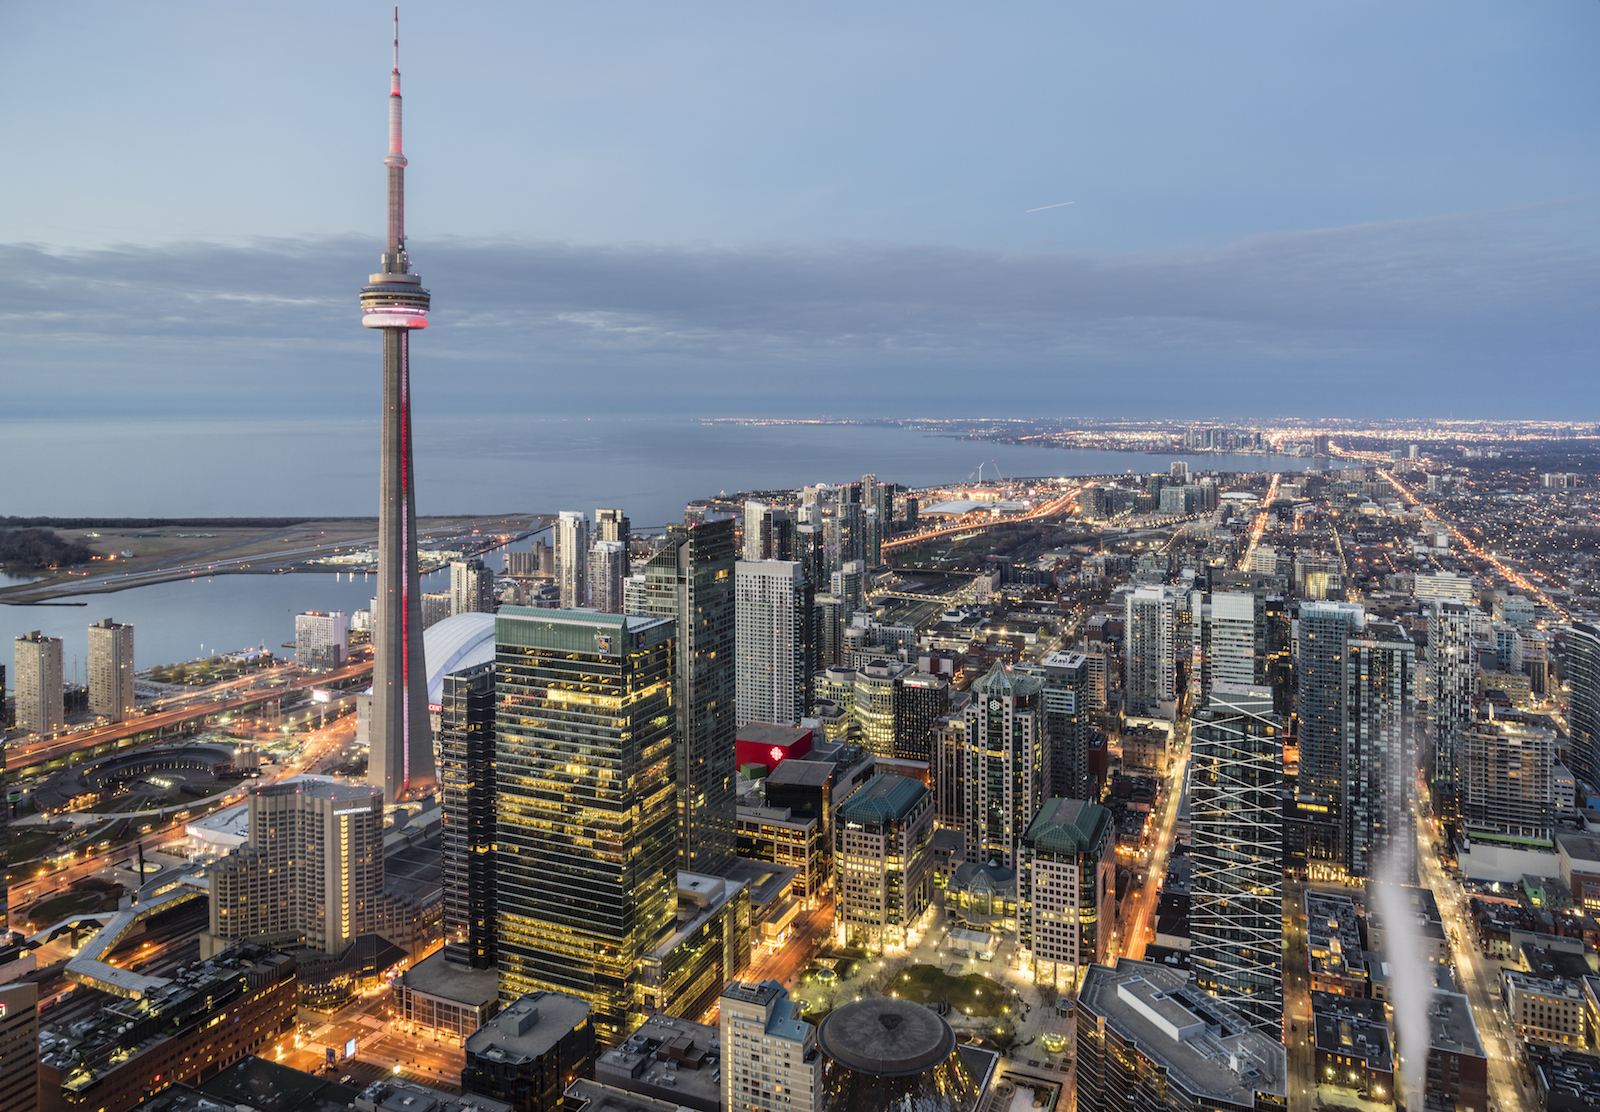
19. Toronto, ON
Average home price (2017):
$1,020,375
Average income to home price: 9.1
5-year annual ROI: 8.7%
Average 5-year rent increase: 18%
Previous year’s unemployment rate (2017): 5.7%
Here are 10 Gorgeous Homes for Sale in Oakville, Ontario (Canada’s Best Place to Live in 2018)
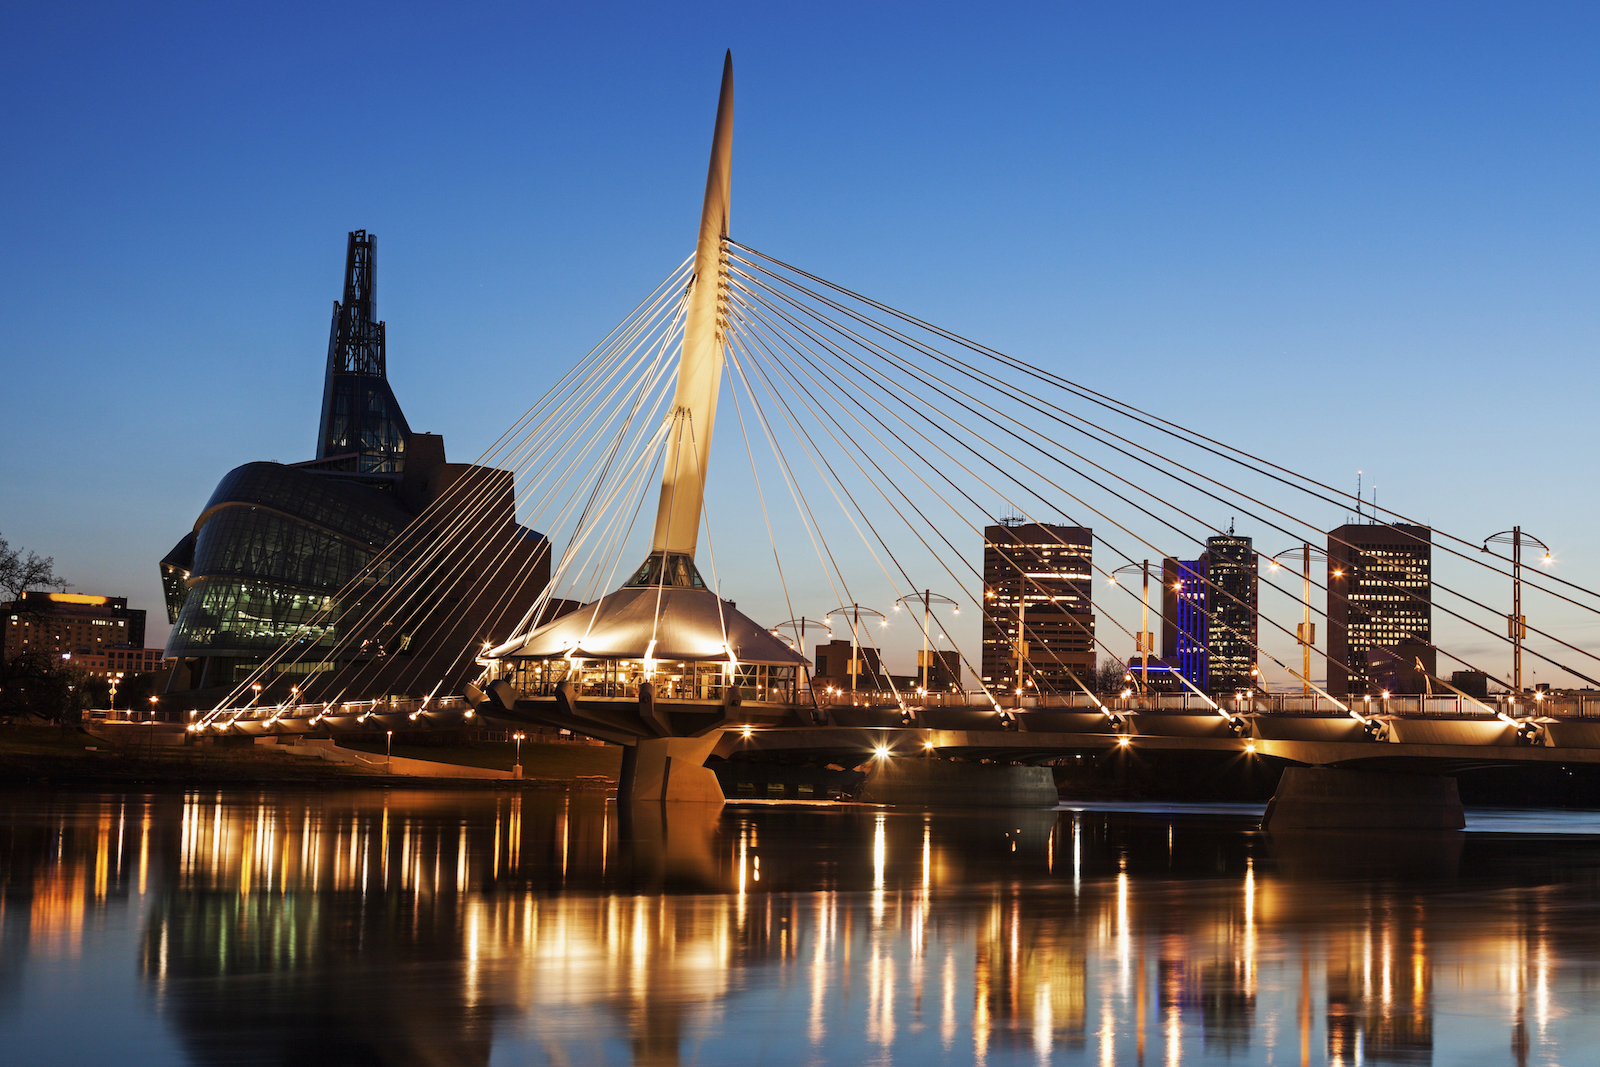
18. Winnipeg, MB
Average home price (2017):
$436,671
Average income to home price: 4.7
5-year annual ROI: 1.6%
Average 5-year rent increase: 24%
Previous year’s unemployment rate (2017): 5.8%
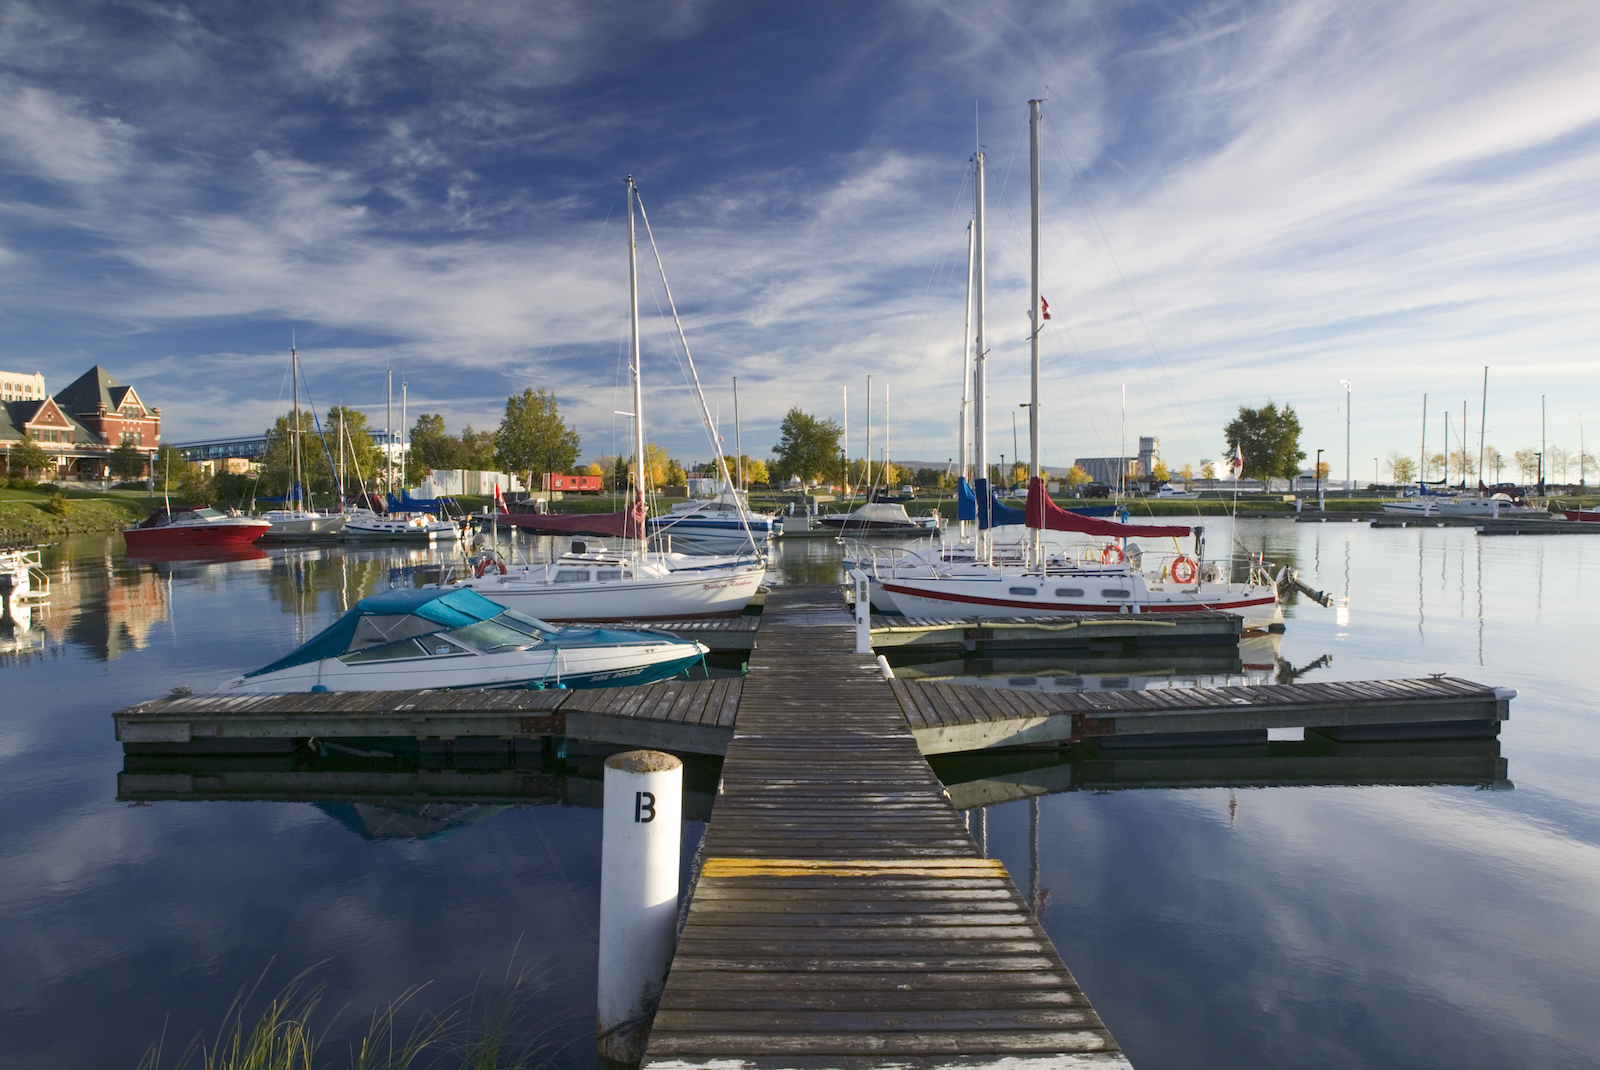
17. Thunder Bay, ON
Average home price (2017):
$453,471
Average income to home price: 5.2
5-year annual ROI: 4.7%
Average 5-year rent increase: 17%
Previous year’s unemployment rate (2017): 8.4%
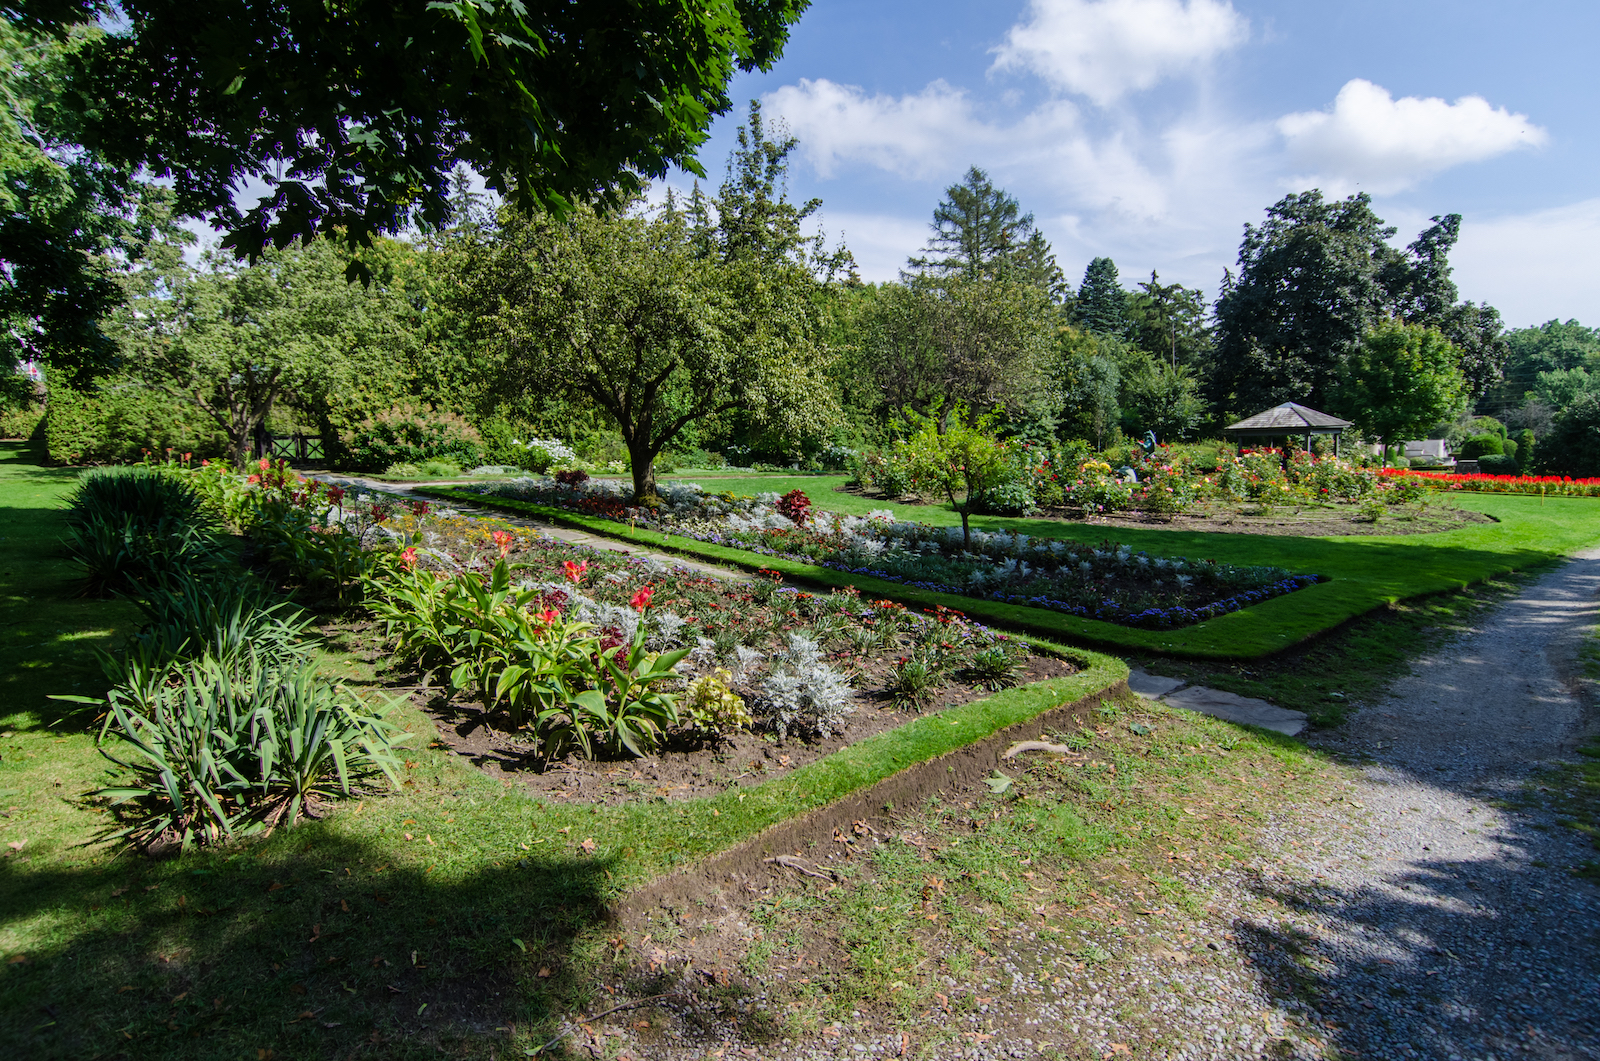
16. Durham-Oshawa, ON
Average home price (2017):
$599,433
Average income to home price: 5.4
5-year annual ROI: 8.0%
Average 5-year rent increase: 24%
Previous year’s unemployment rate (2017): 8.1%
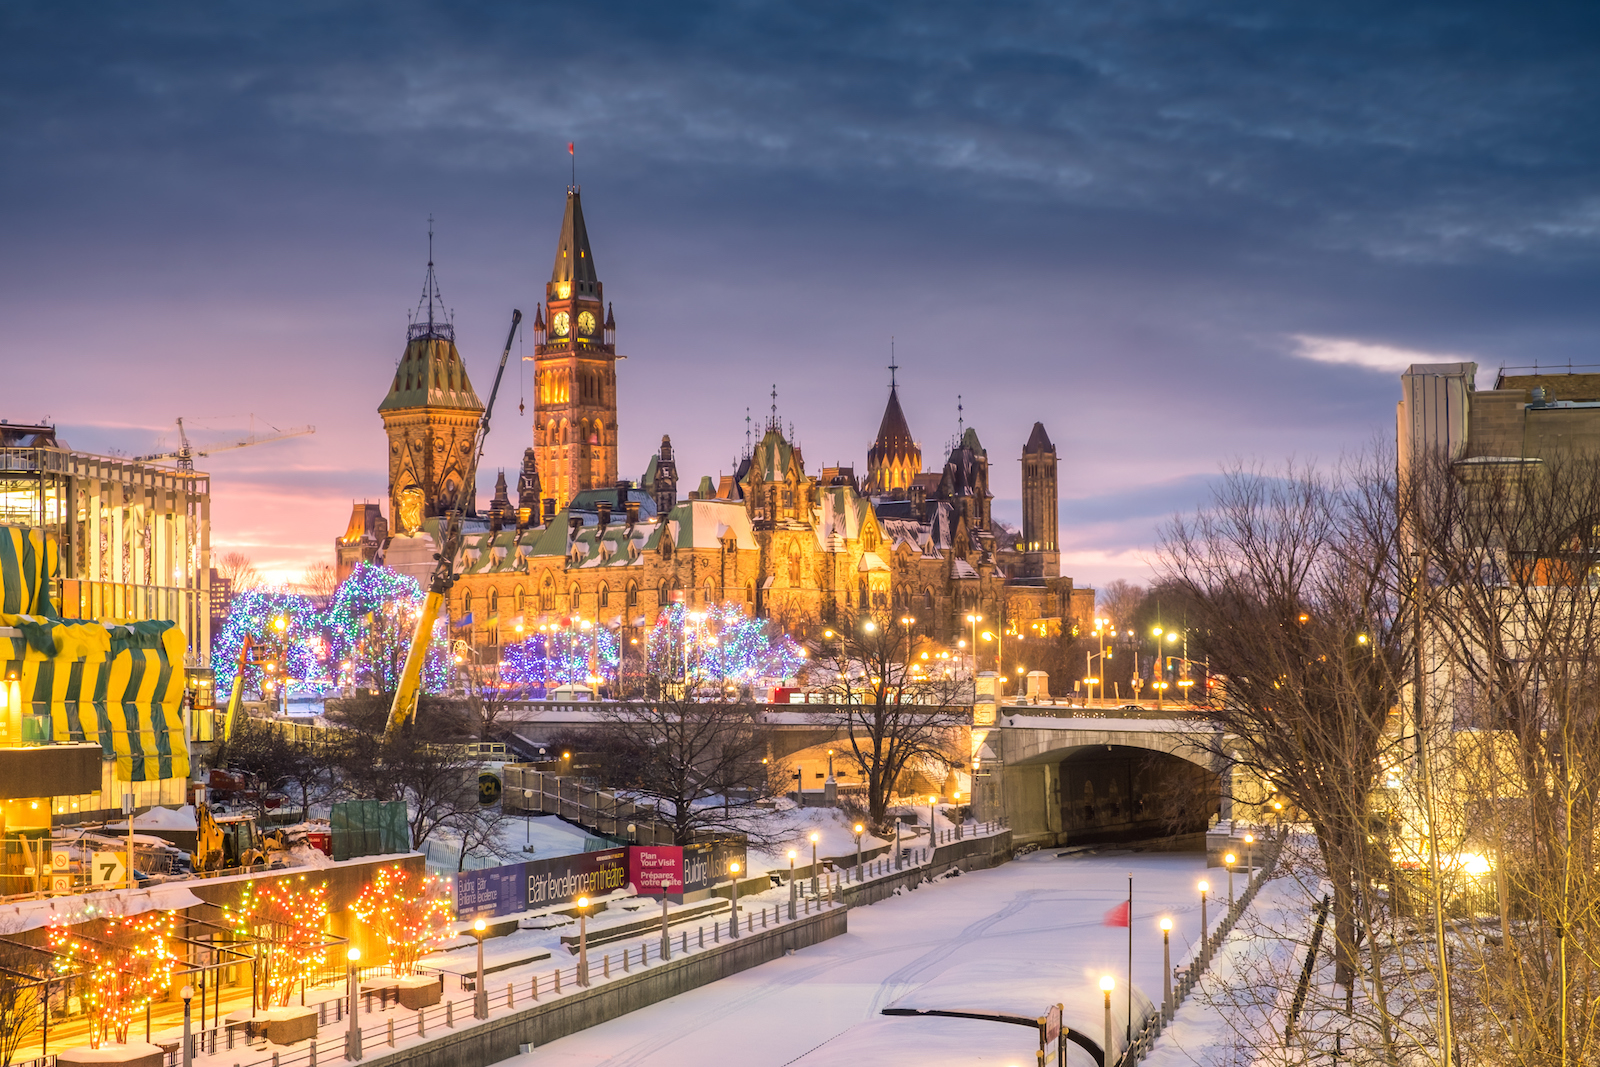
15. Ottawa, ON
Average home price (2017):
$521,934
Average income to home price: 4.9
5-year annual ROI: 1.6%
Average 5-year rent increase: 11%
Previous year’s unemployment rate (2017): 5.5%
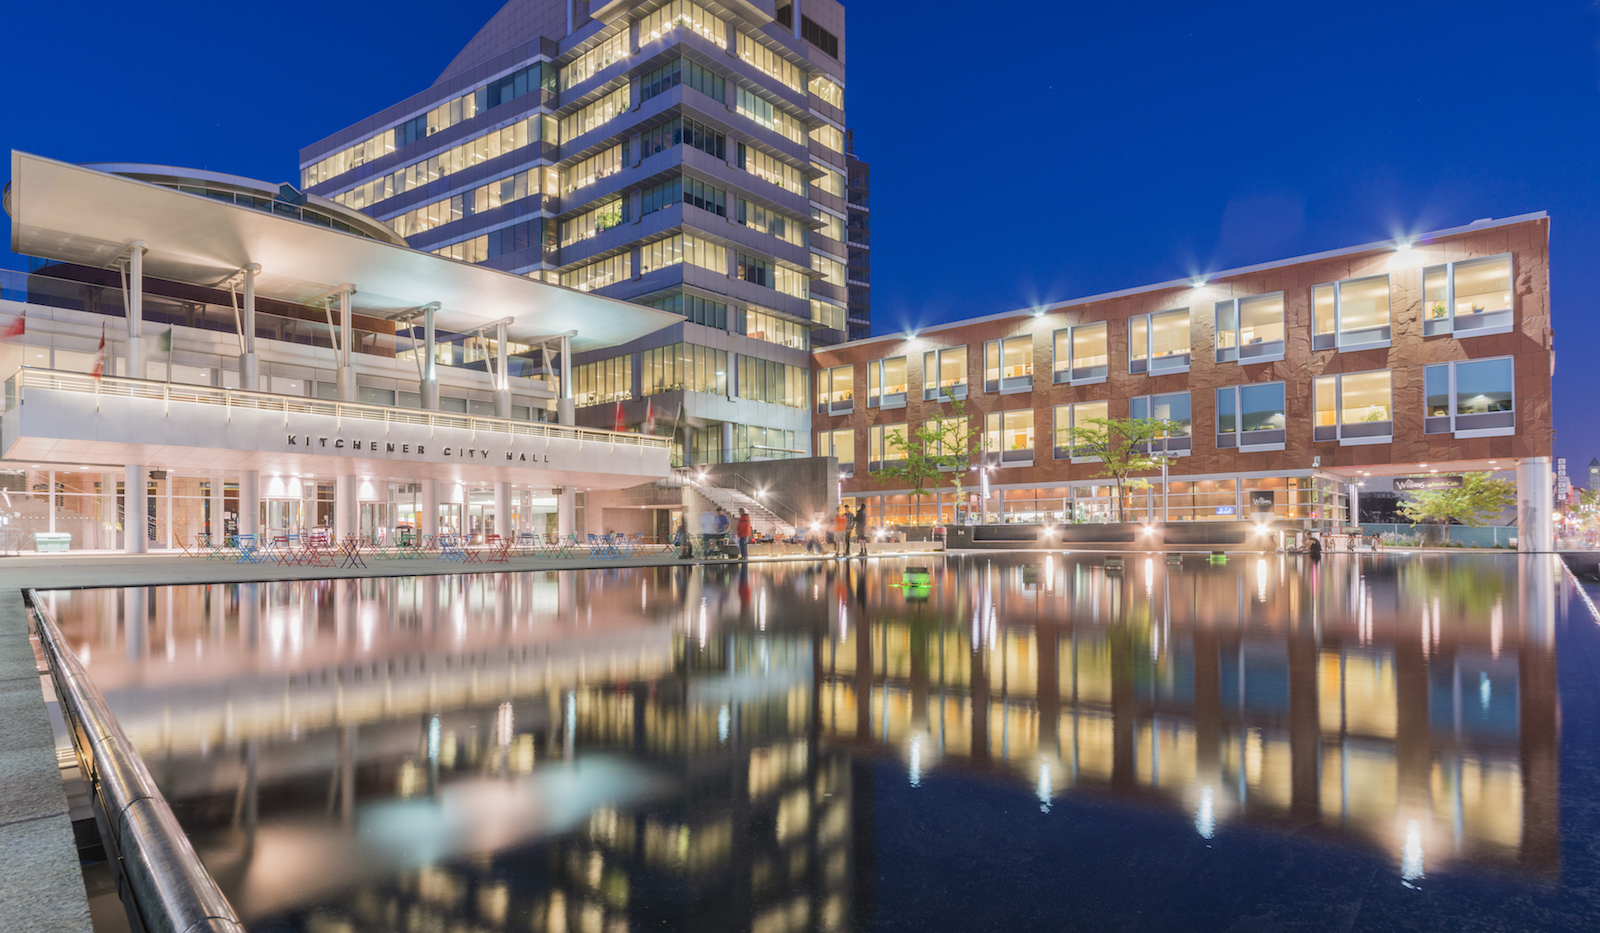
14. Kitchener-Cambridge-Waterloo, ON
Average home price (2017):
$543,102
Average income to home price: 5.5
5-year annual ROI: 4.6%
Average 5-year rent increase: 20%
Previous year’s unemployment rate (2017): 6.1%
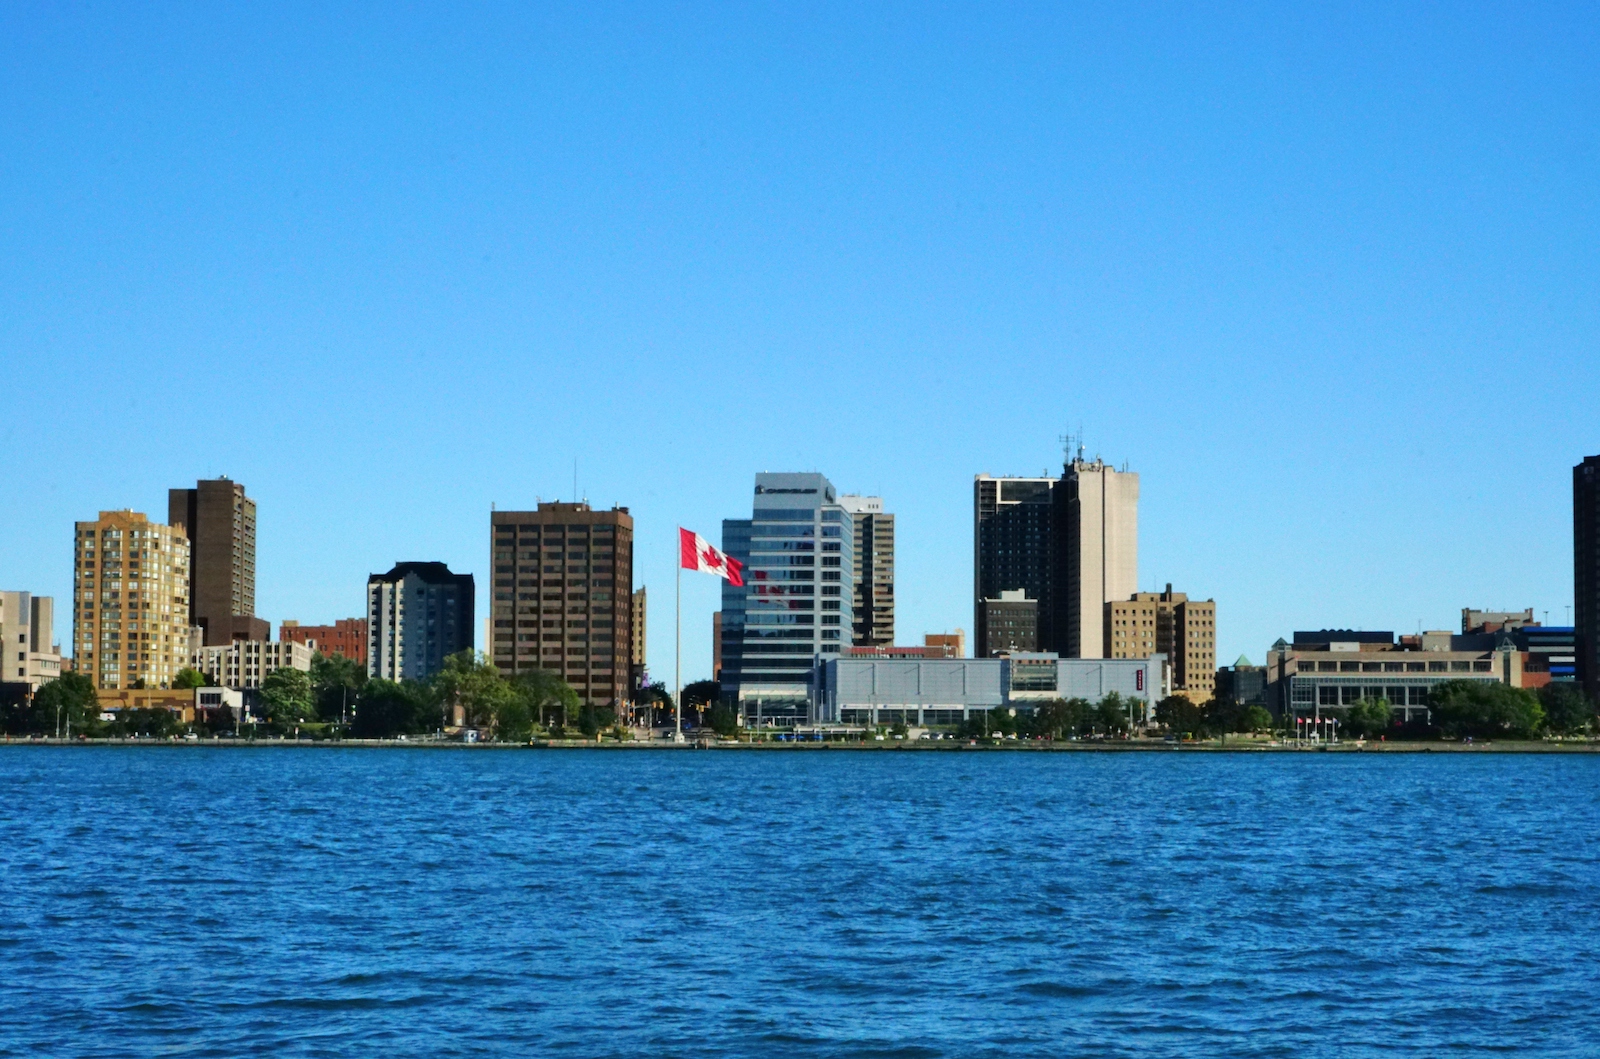
13. Windsor, ON
Average home price (2017):
$464,981
Average income to home price: 5.6
5-year annual ROI: 7.1%
Average 5-year rent increase: 11%
Previous year’s unemployment rate (2017): 5.6%

12. St. Catharines, ON
Average home price (2017):
$546,770
Average income to home price: 6.6
5-year annual ROI: 4.7%
Average 5-year rent increase: 15%
Previous year’s unemployment rate (2017): 5.6%
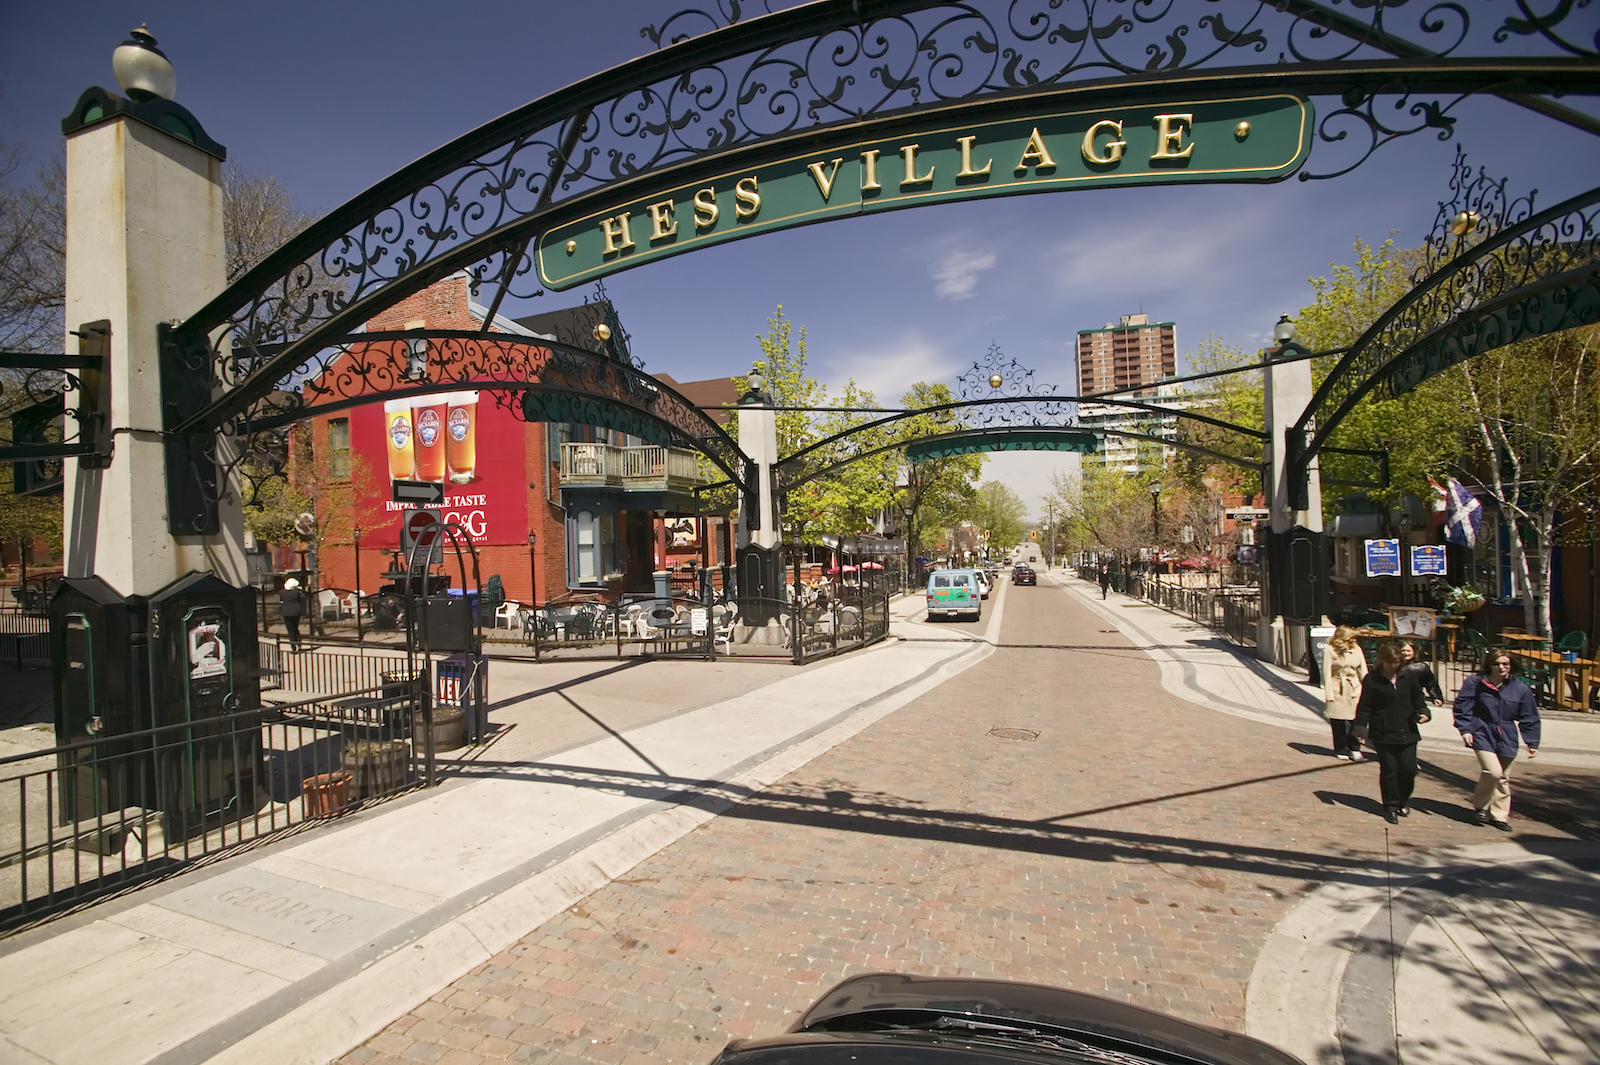
11. Hamilton, ON
Average home price (2017):
$622,853
Average income to home price: 6.3
5-year annual ROI: 3.9%
Average 5-year rent increase: 24%
Previous year’s unemployment rate (2017): 5.5%
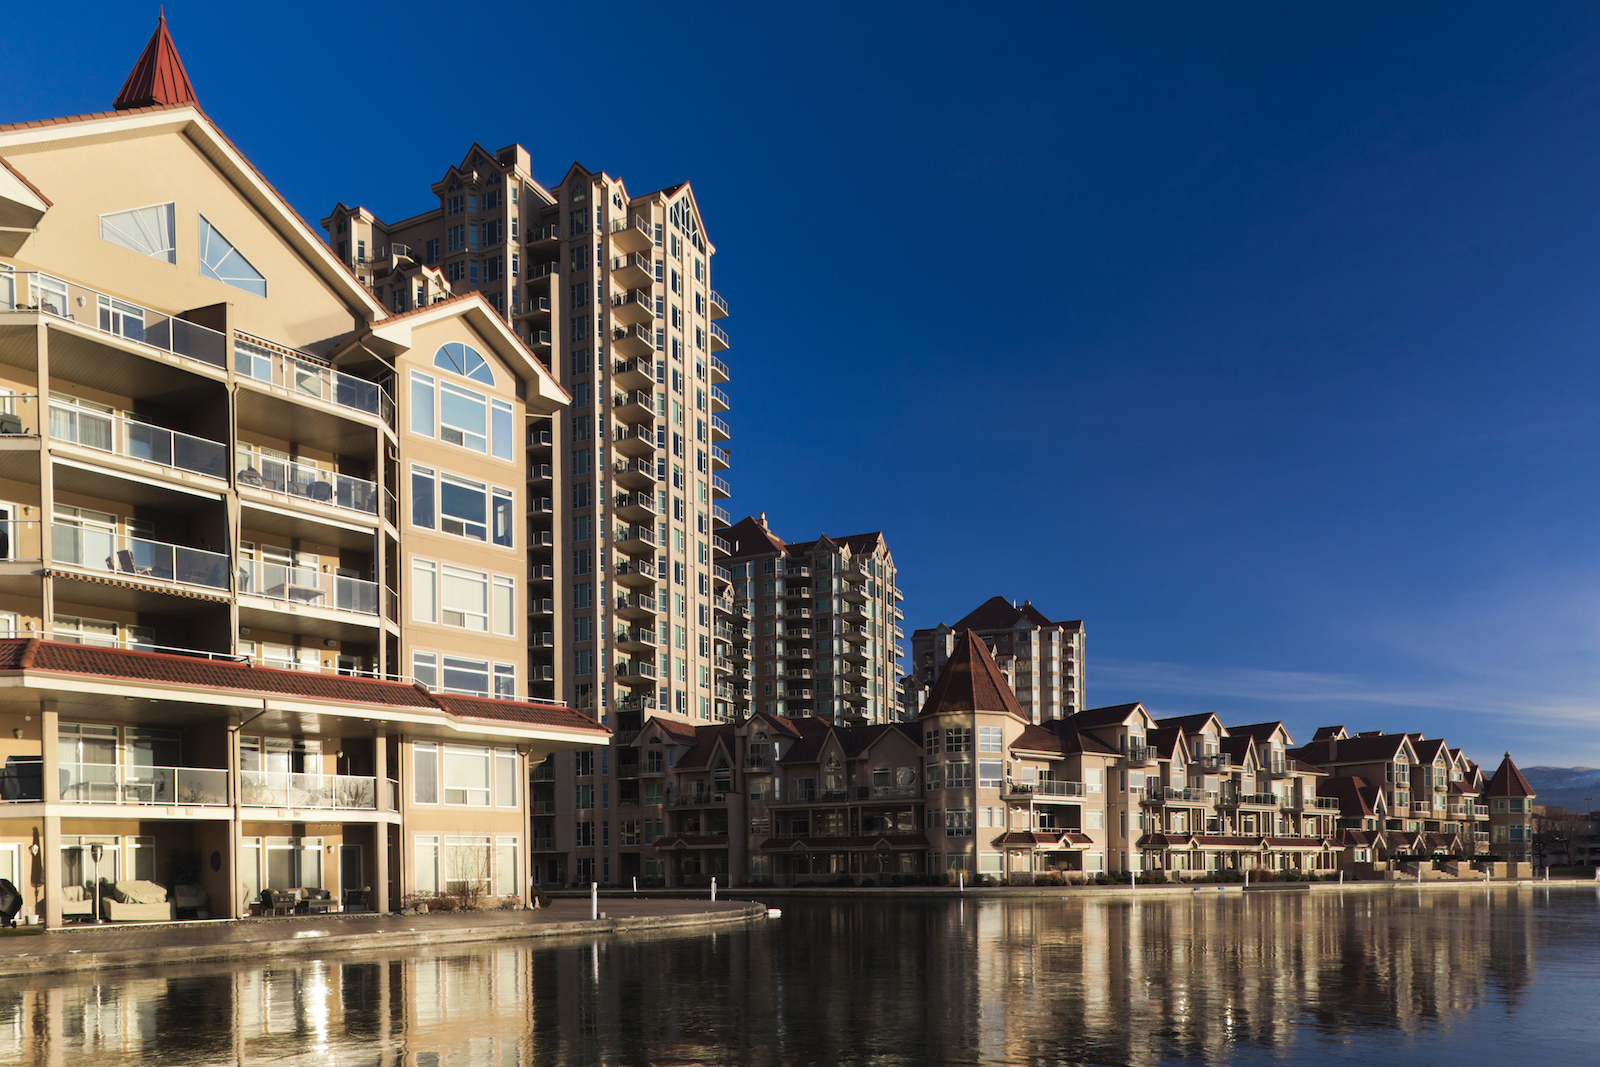
10. Kelowna, BC
Average home price (2017):
$890,583
Average income to home price: 9.3
5-year annual ROI: 3.8%
Average 5-year rent increase: 23%
Previous year’s unemployment rate (2017): 5.1%
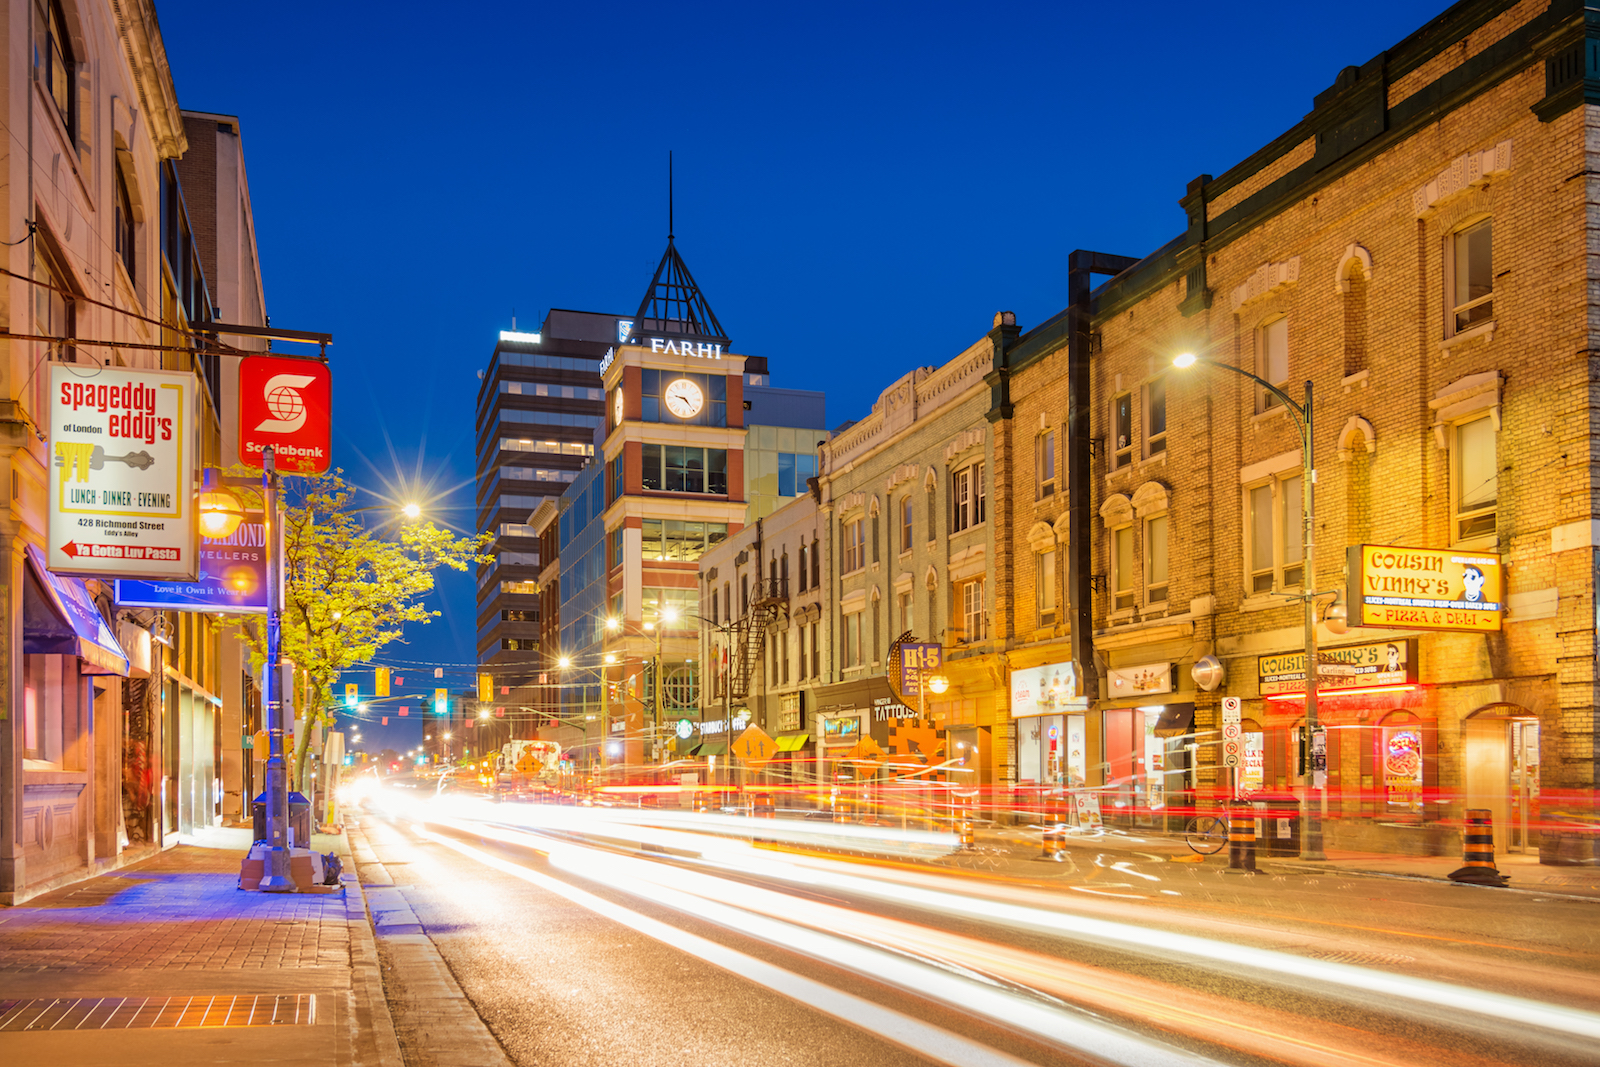
9. London, ON
Average home price (2017):
$485,801
Average income to home price: 5.4
5-year annual ROI: 6.3%
Average 5-year rent increase: 14%
Previous year’s unemployment rate (2017): 6.6%
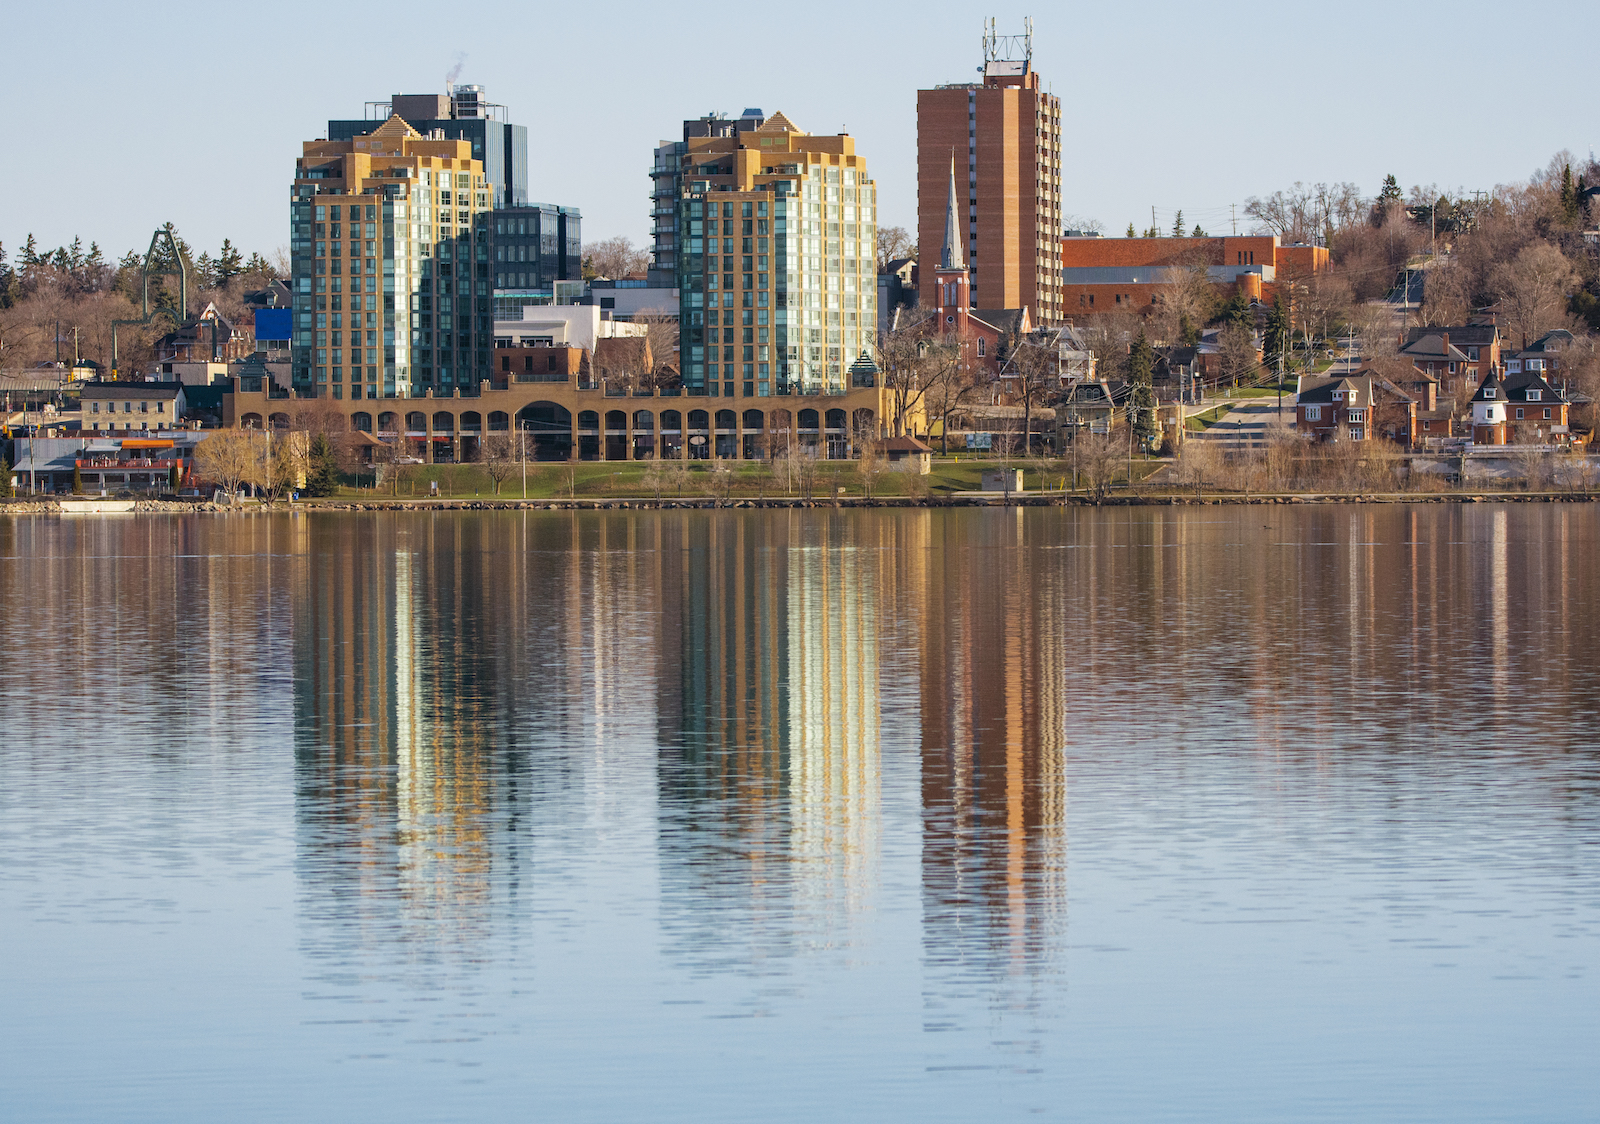
8. Barrie, ON
Average home price (2017):
$632,509
Average income to home price: 6.3
5-year annual ROI: 8.2%
Average 5-year rent increase: 16%
Previous year’s unemployment rate (2017): 5.4%
Go Inside 5 of Canada’s Most Expensive Real Estate Listings Right Now
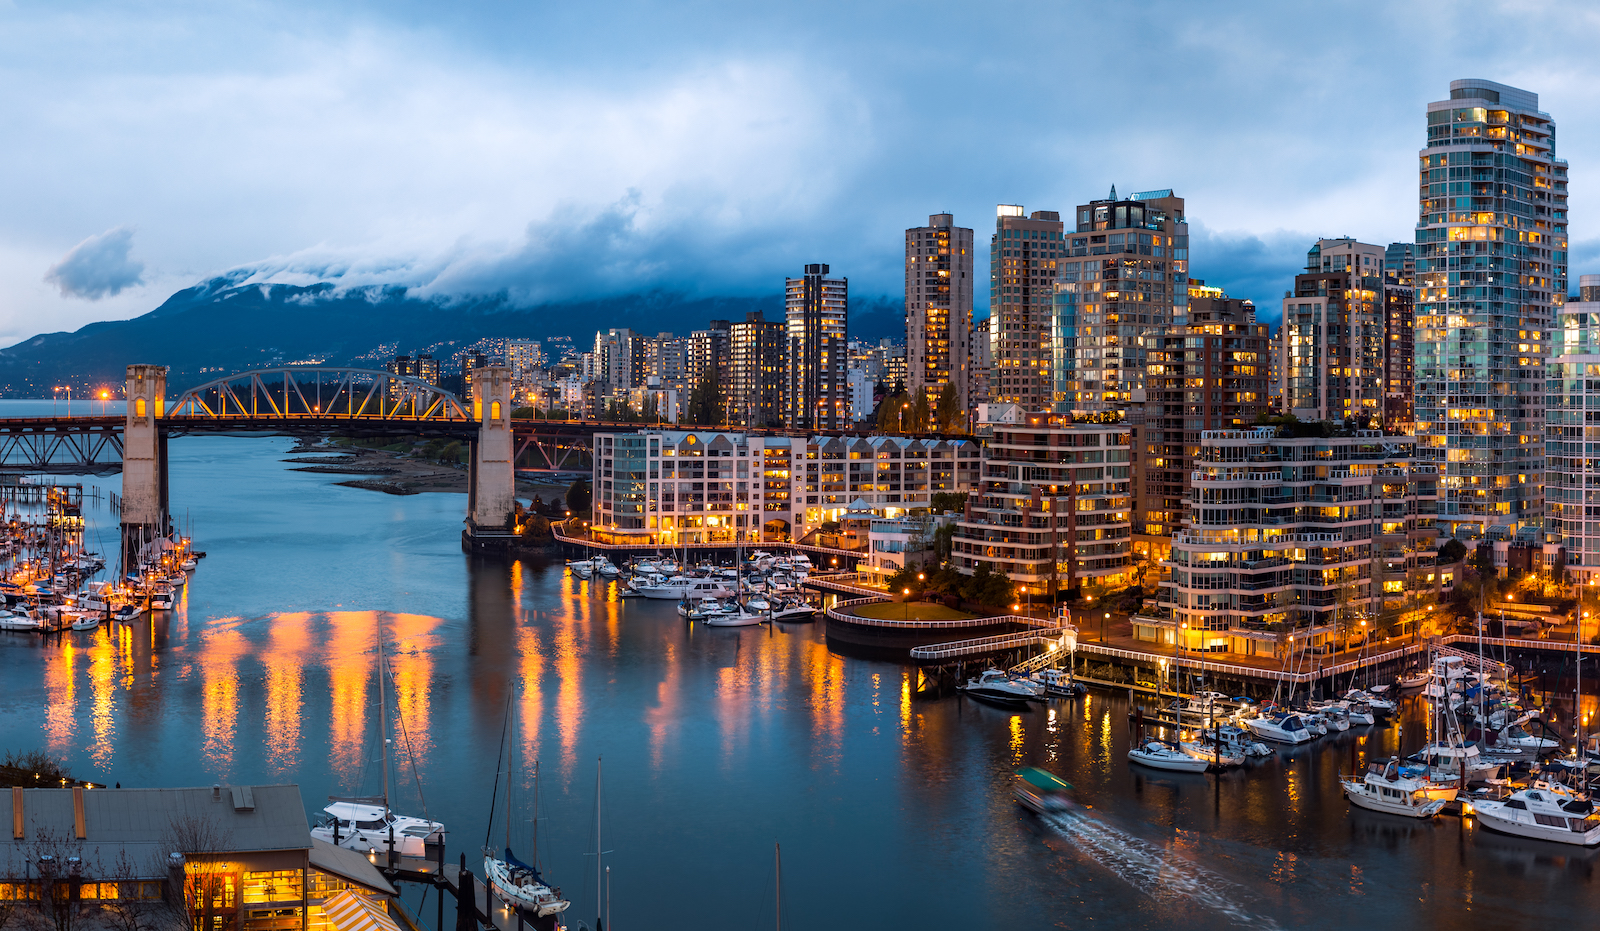
7. Vancouver, BC
Average home price (2017):
$2,264,596
Average income to home price: 22.6
5-year annual ROI: 13.1%
Average 5-year rent increase: 24%
Previous year’s unemployment rate (2017): 5.6%
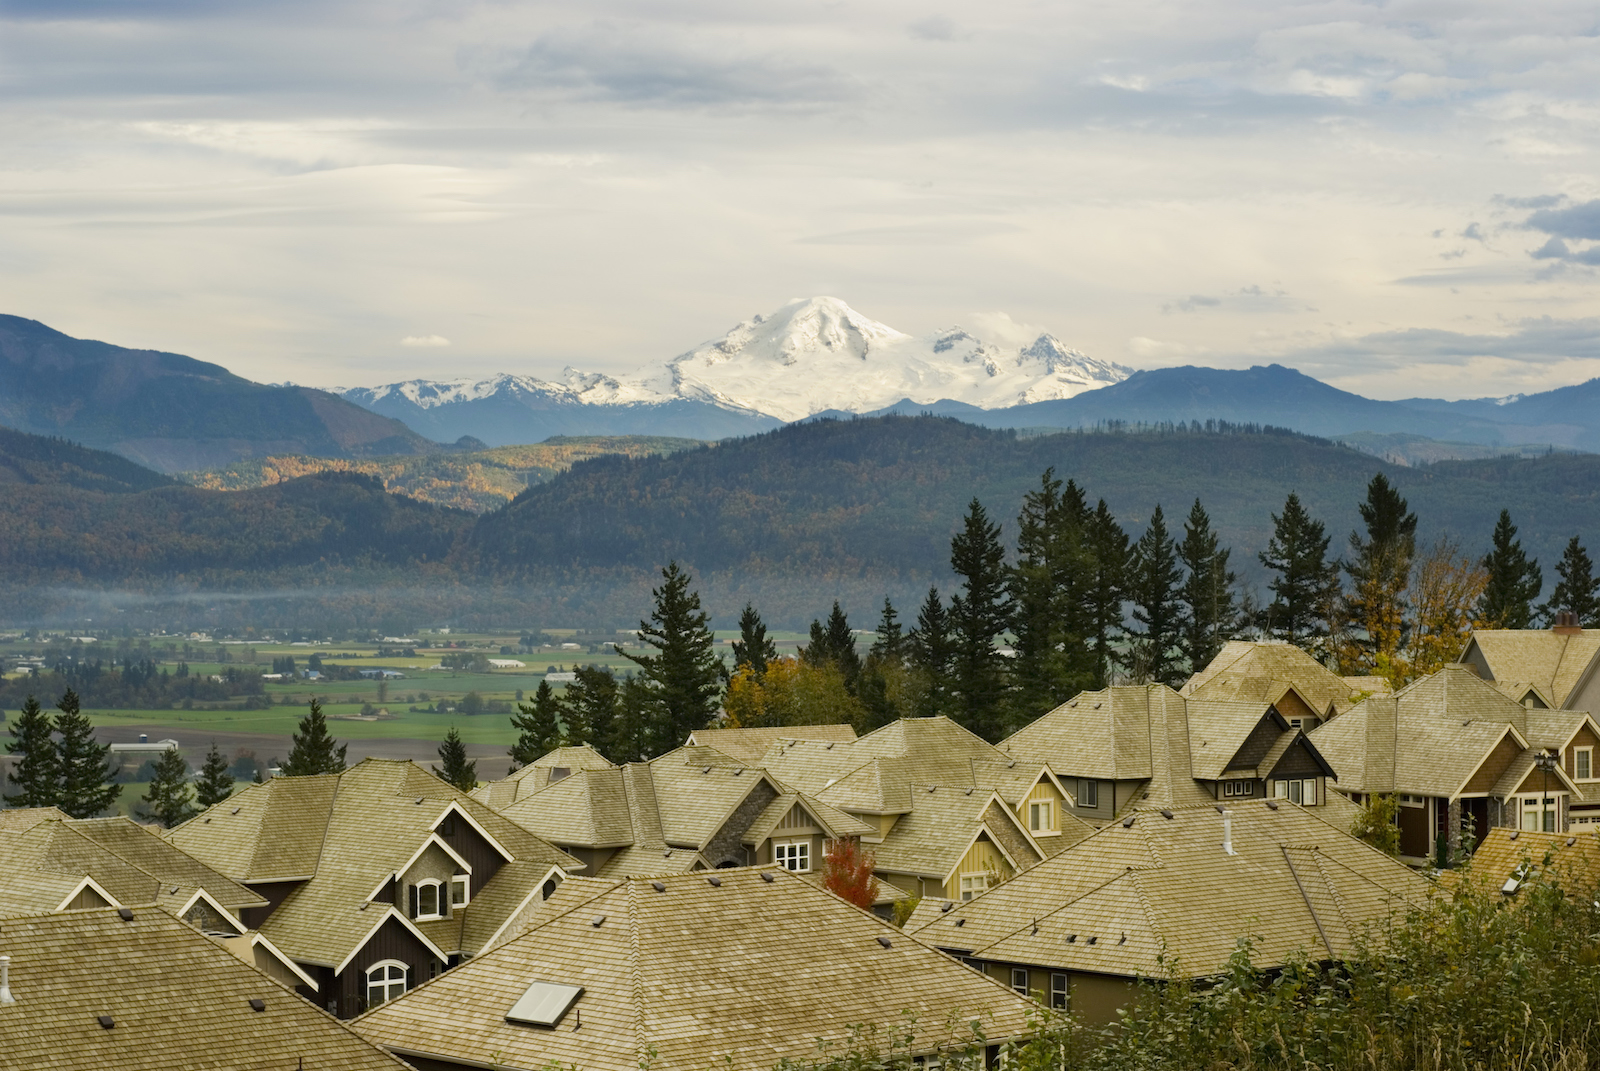
6. Abbotsford-Mission, BC
Average home price (2017):
$972,360
Average income to home price: 10.6
5-year annual ROI: 11.2%
Average 5-year rent increase: 15%
Previous year’s unemployment rate (2017): 5.5%
Thinking of buying a house in Abbotsford? It also boasts some of the lowest taxes in all of Canada.
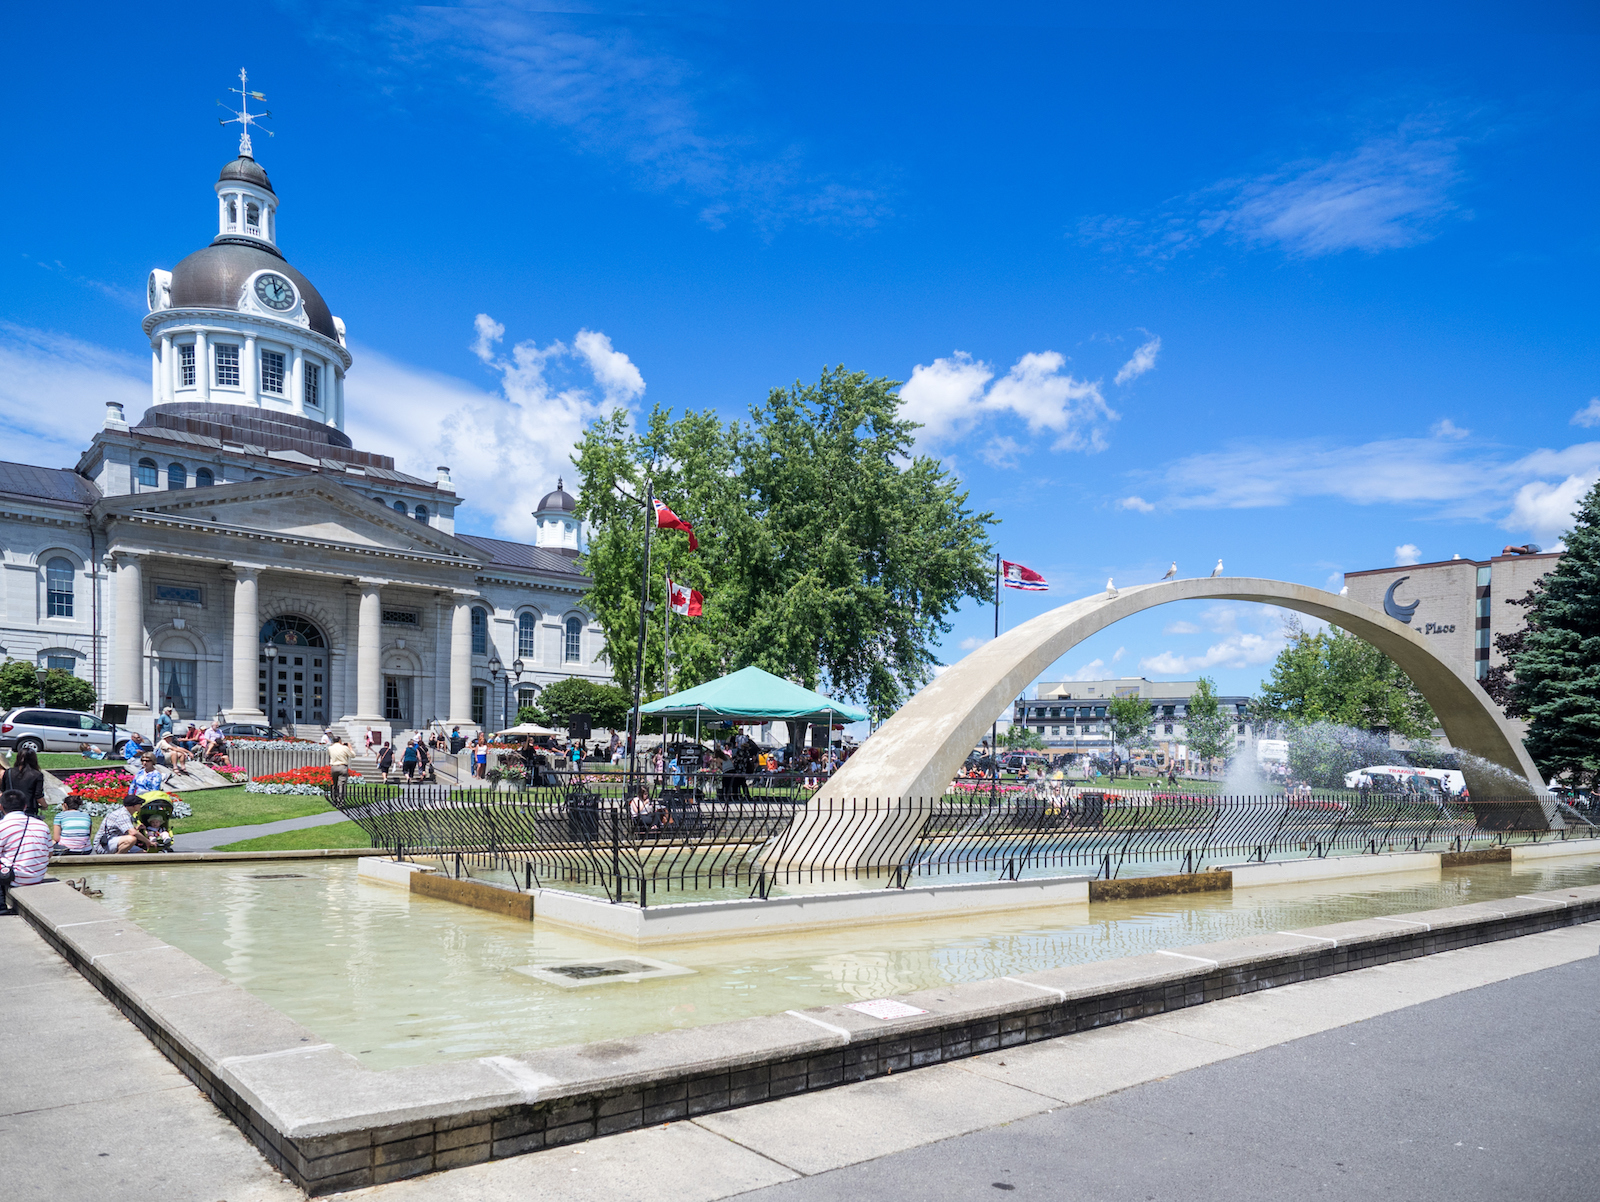
5. Kingston, ON
Average home price (2017):
$416,028
Average income to home price: 4.4
5-year annual ROI: 7.0%
Average 5-year rent increase: 17%
Previous year’s unemployment rate (2017): 5.9%
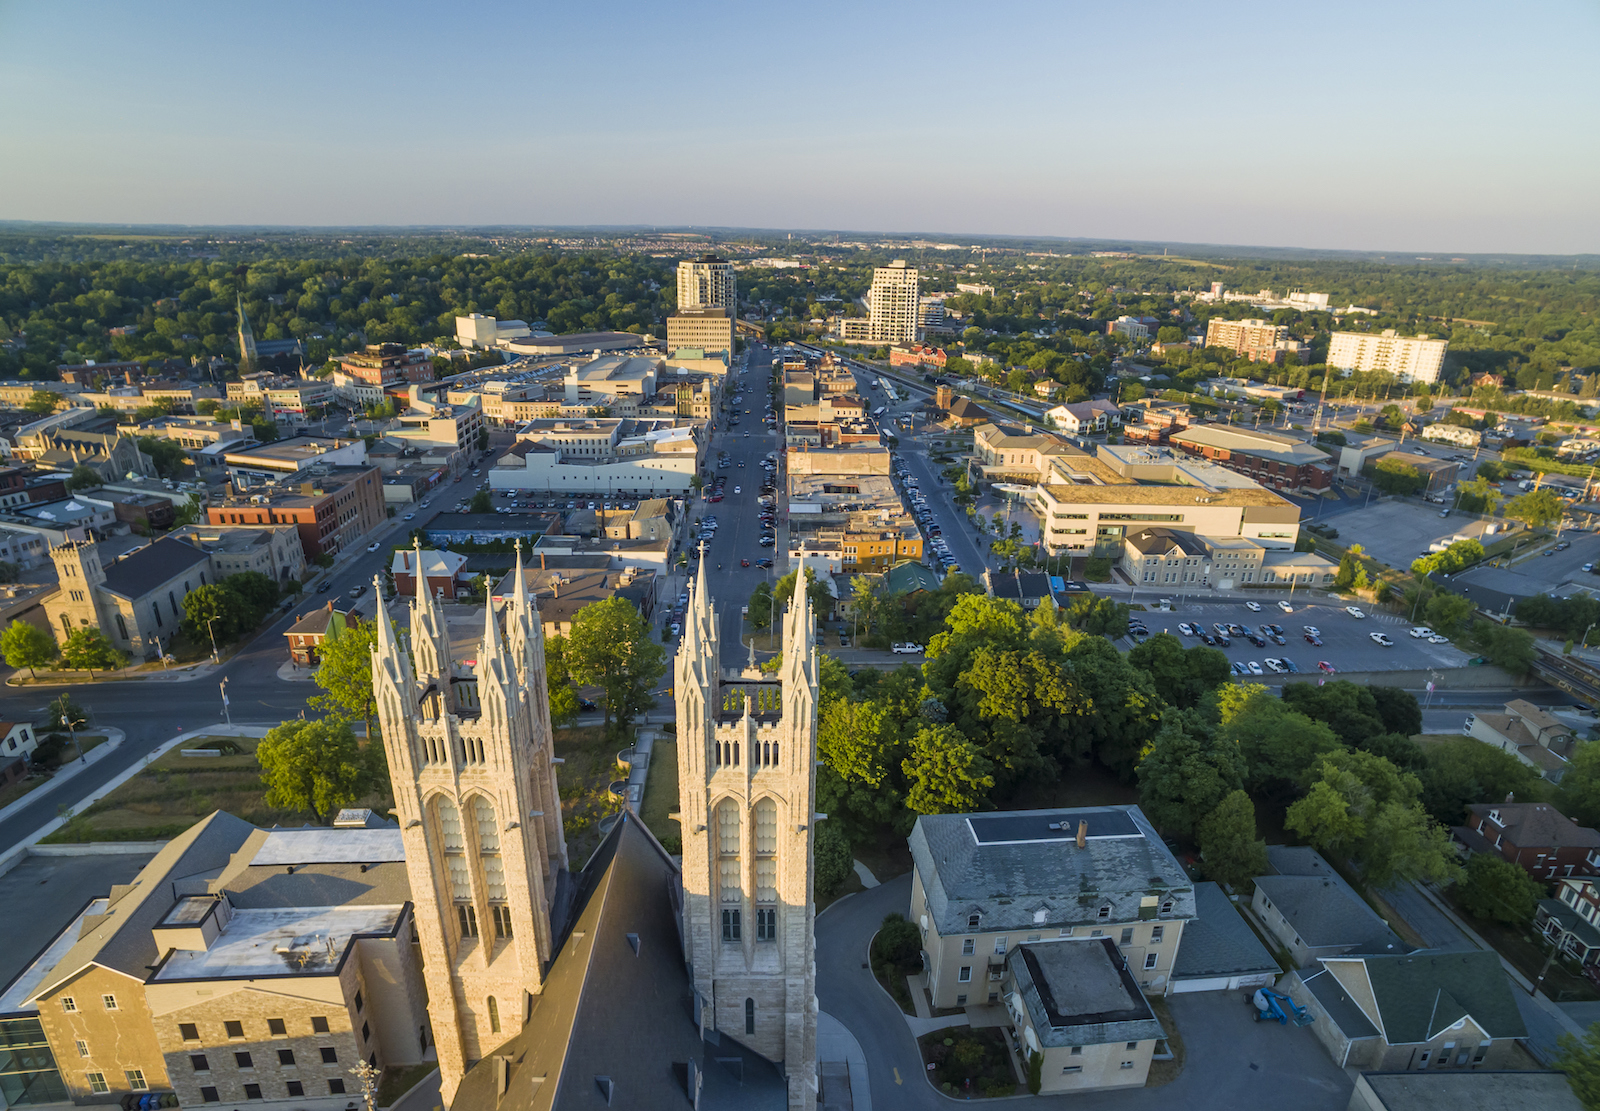
4. Guelph, ON
Average home price (2017):
$718,898
Average income to home price: 6.9
5-year annual ROI: 10.5%
Average 5-year rent increase: 21%
Previous year’s unemployment rate (2017): 5.0%
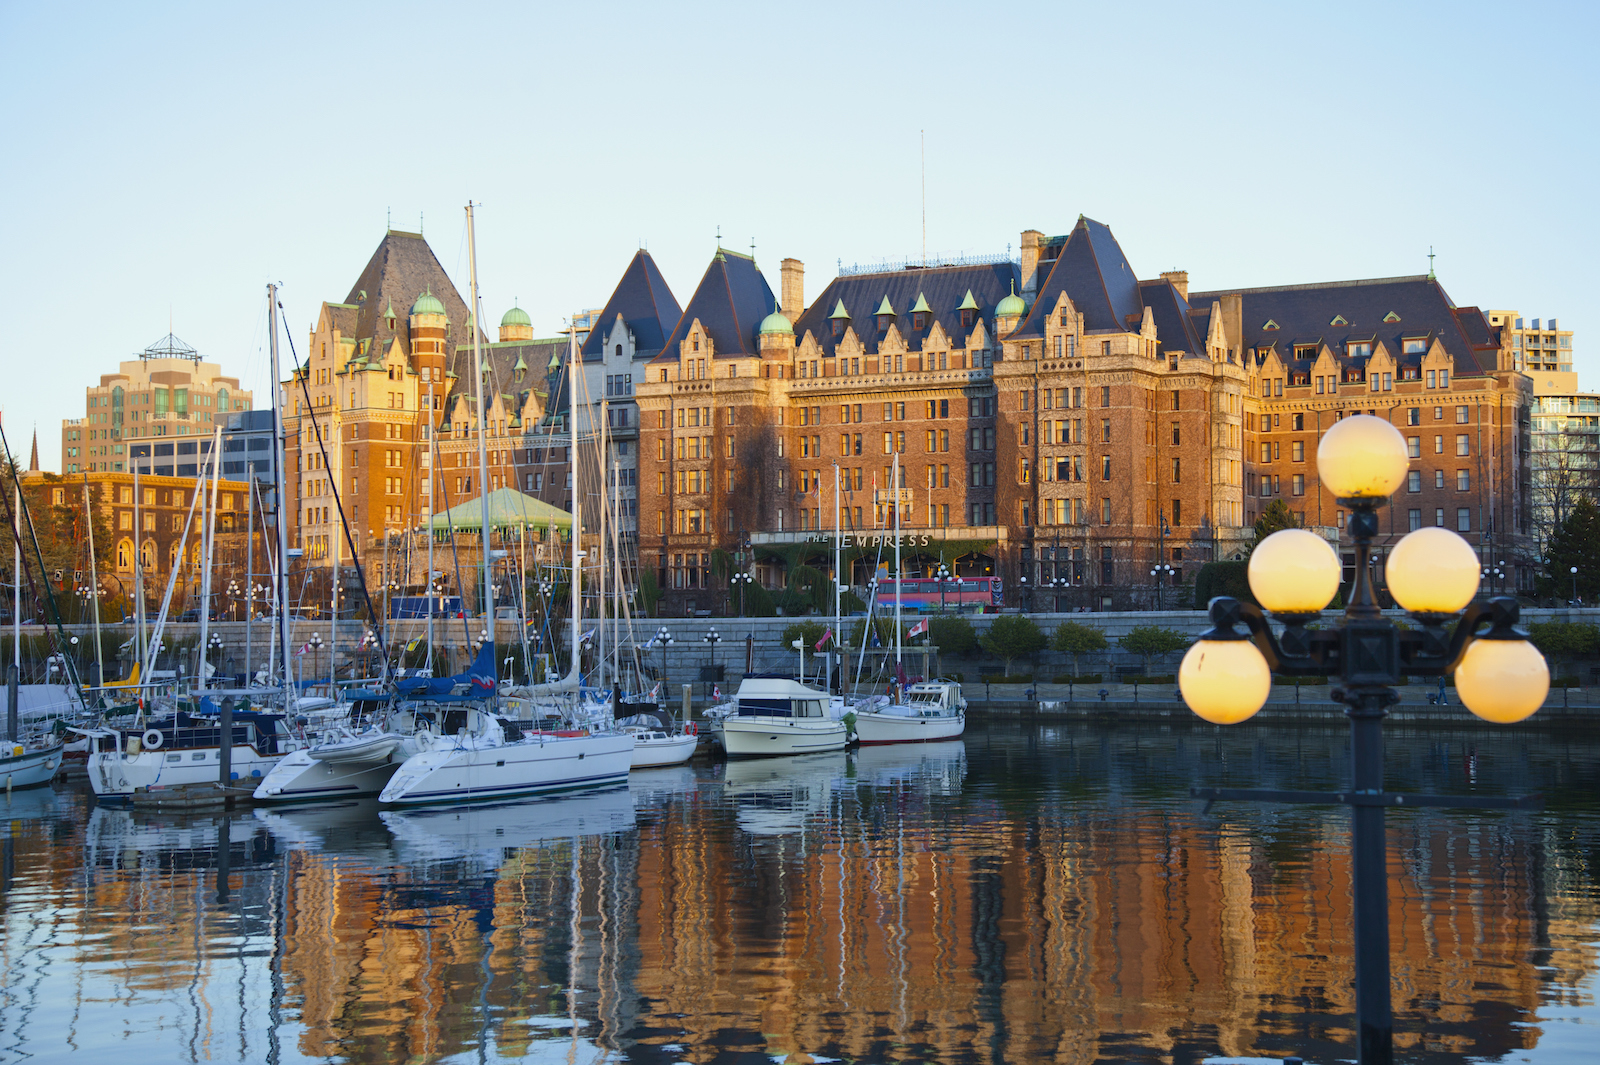
3. Victoria, BC
Average home price (2017):
$975,838
Average income to home price: 10.3
5-year annual ROI: 8.4%
Average 5-year rent increase: 20%
Previous year’s unemployment rate (2017): 4.7%
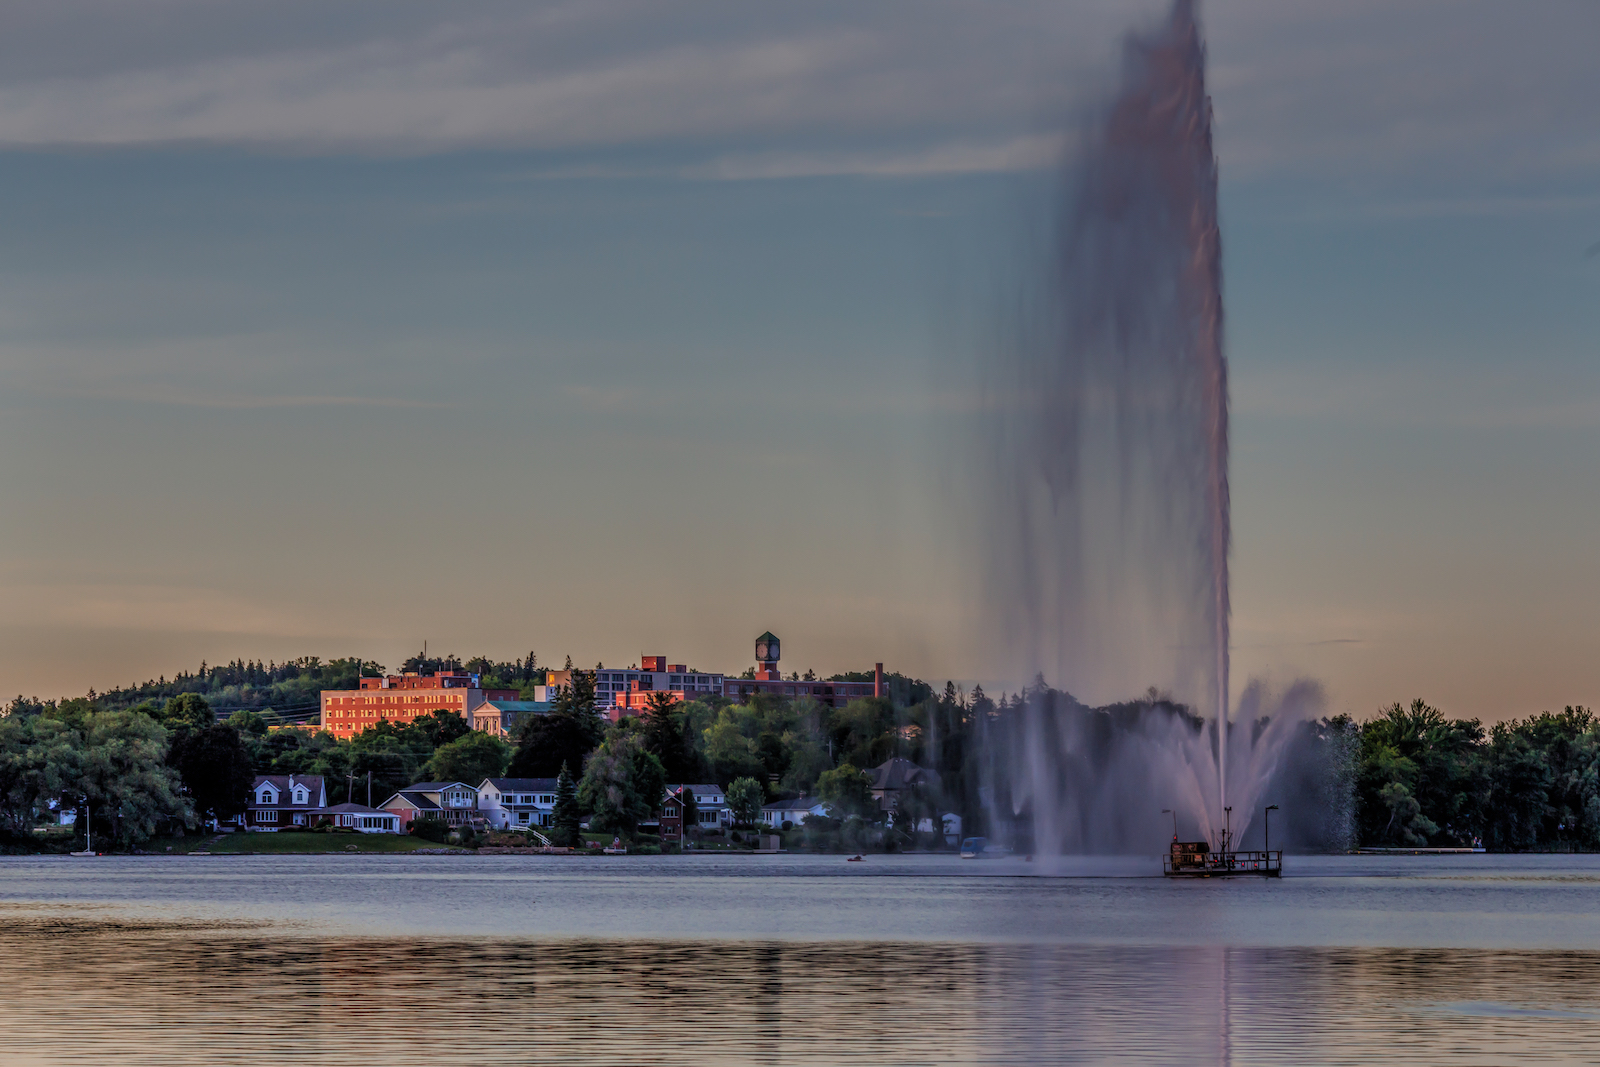
2. Peterborough, ON
Average home price (2017):
$413,394
Average income to home price: 4.8
5-year annual ROI: 4.6%
Average 5-year rent increase: 10%
Previous year’s unemployment rate (2017): 5.4%
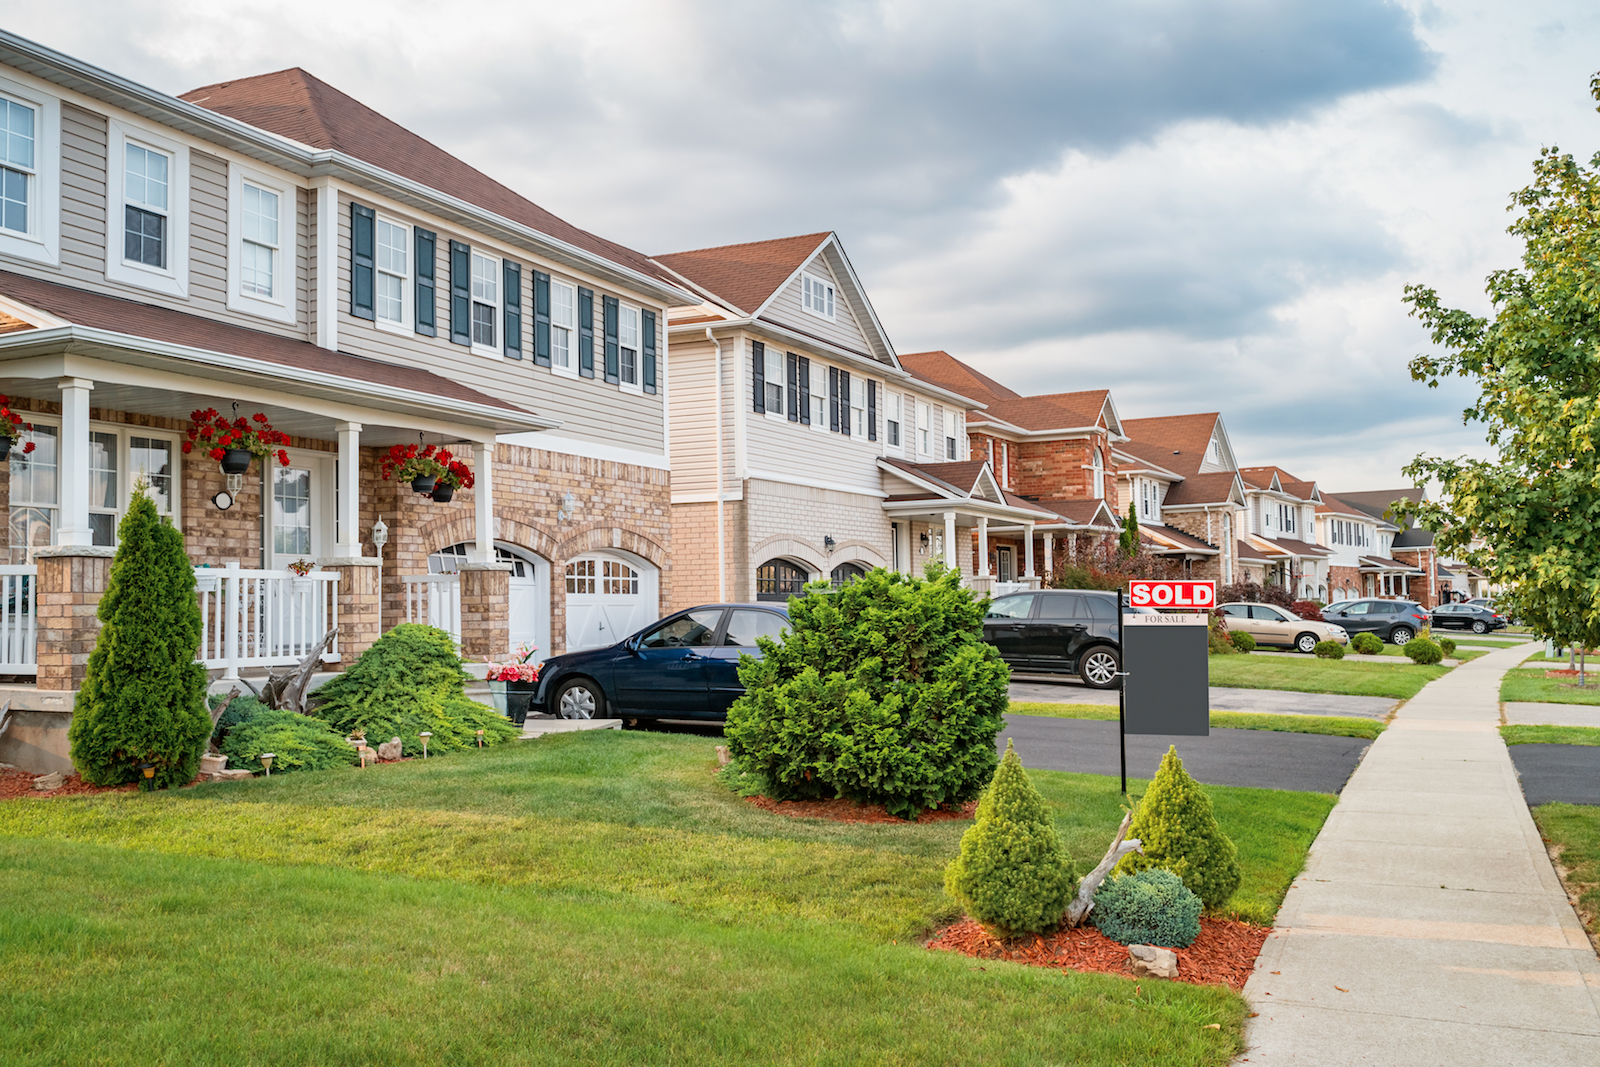
1. Brantford, ON
Average home price (2017):
$506,016
Average income to home price: 5.9
5-year annual ROI: 4.5%
Average 5-year rent increase: 20%
Previous year’s unemployment rate (2017): 4.9%
These are the 11 Coolest Barn and Church Conversions Across Canada.
HGTV your inbox.
By clicking "SIGN UP” you agree to receive emails from HGTV and accept Corus' Terms of Use and Corus' Privacy Policy.


